
Results at a glance
A switched-current temperature-sensing front end in 65-nm bulk CMOS, 22-nm FD-SOI and 16-nm FinFET.
Physical sign-off
DRC, LVS, antenna, density and latch-up checks.
Reliability verification
Electromigration, IR drop, redundant supply vias and gate-oxide voltage.
Extracted-layout verification
Post-layout simulation with extracted parasitics in all three technologies; PVT and 200-chip Monte Carlo.
| Measure | 65-nm bulk CMOS | 22-nm FD-SOI | 16-nm FinFET |
|---|---|---|---|
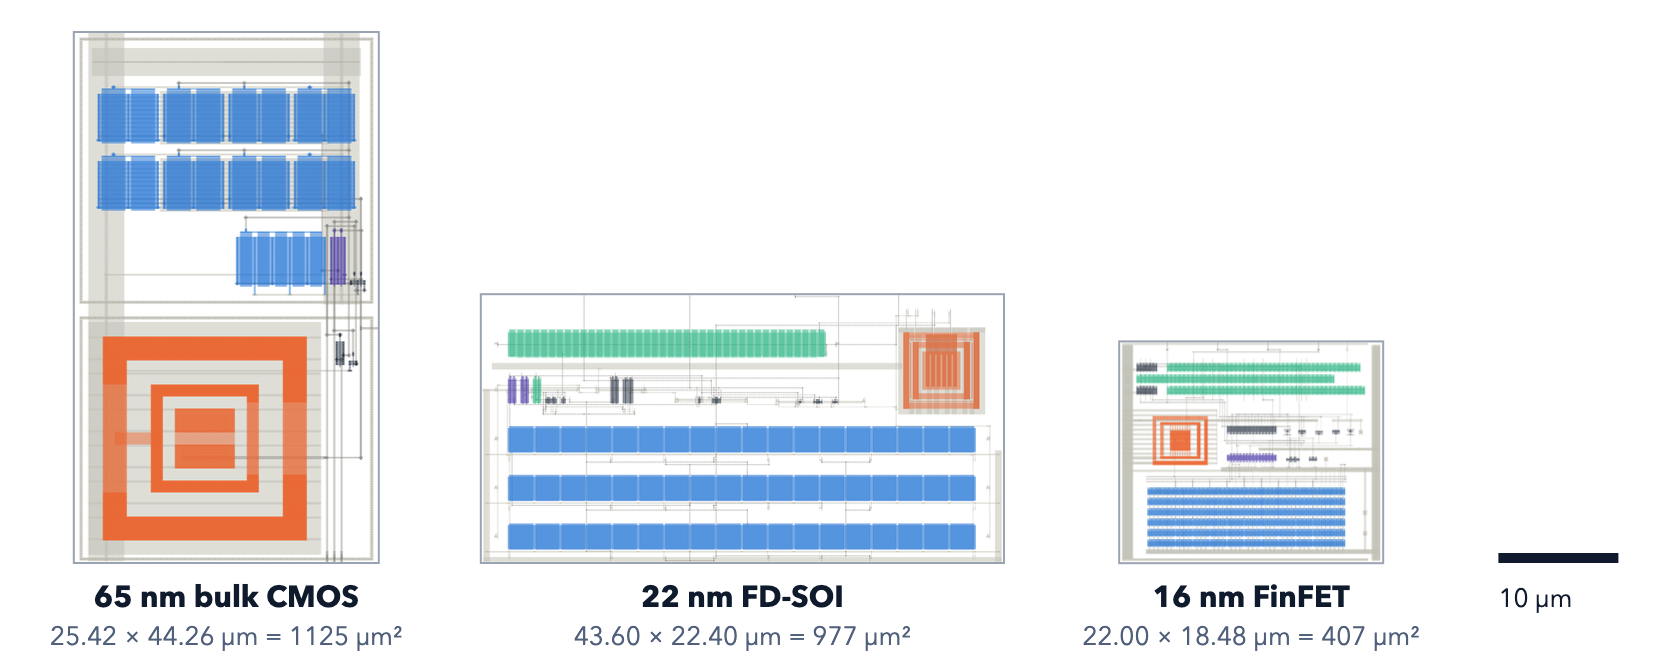
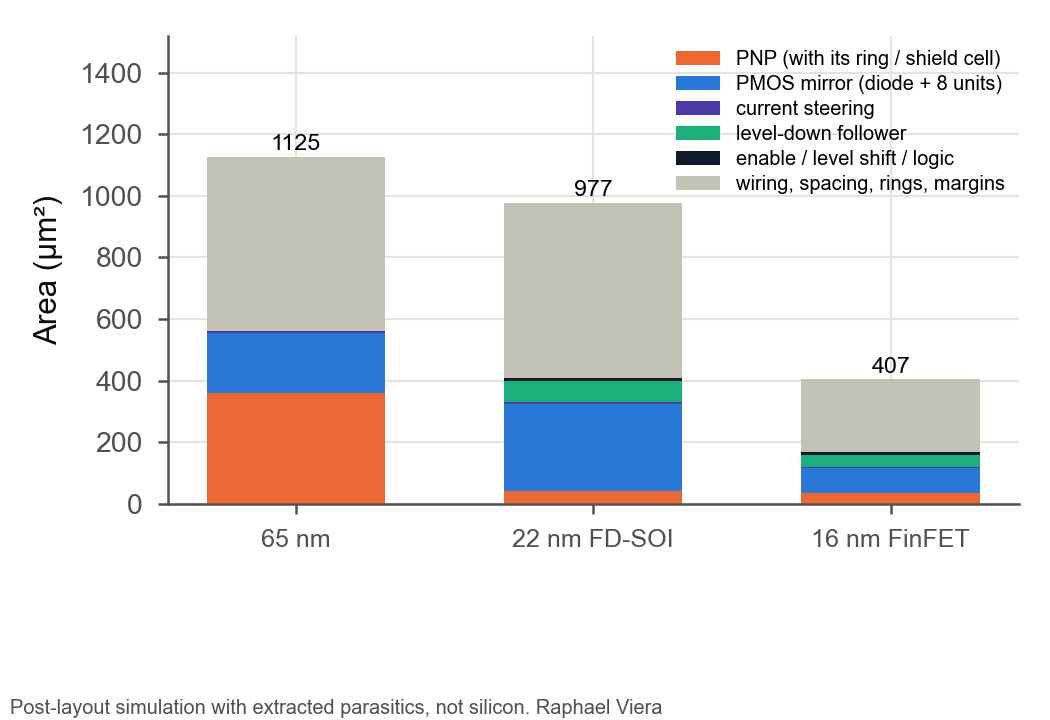
| Drawn macro area | 1,125 µm² | 977 µm² | 407 µm² |
| Typical power at 27 °C | 22.6 µW | 50.6 µW | 50.3 µW |
| Two-point calibrated error, MC 3σ | ±0.075 °C | ±0.442 °C | ±0.152 °C |
| Noise, one ΔVBE measurement | 45 mK rms | 72 mK rms | 153 mK rms |
Two-point calibration at 0 and 85 °C, error over 0–85 °C; process + mismatch Monte Carlo, 200 chips per technology. Noise integrated over 0.1 Hz–1 kHz. Power includes the 10-µA bias and, at 22 / 16 nm, the follower. All values are extracted-layout simulations.
Sign-off & reliability
Design, layout and verification across 65-nm bulk CMOS, 22-nm FD-SOI and 16-nm FinFET.
Physical sign-off
- Design-rule checks (DRC)
- Layout versus schematic (LVS)
- Antenna, density and latch-up checks
Reliability verification
- Electromigration
- IR drop
- Redundant supply vias
- Gate-oxide voltage
Extracted-layout verification
Post-layout simulation with extracted parasitics in all three technologies, including PVT characterization and 200-chip process-plus-mismatch Monte Carlo.
AI agents carried out the design, layout and verification under human direction. Human hands-on time: < 1 h.
How it works
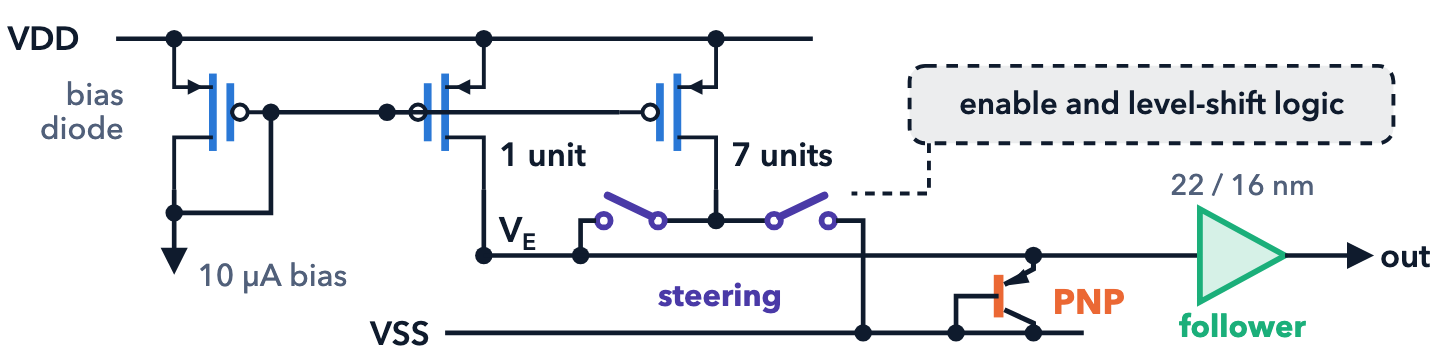
The block is a switched-current ΔVBE sensor: a PMOS mirror of eight matched units drives one vertical PNP with 1 or 8 units. The difference of the two base-emitter voltages, ΔVBE = (kT/q)·ln 8, is proportional to absolute temperature. In 22 and 16 nm it uses 1.8 V I/O devices and a follower output: the PNP needs more than the 0.8 V core supply at 0 °C.
Post-layout simulation with extracted parasitics, not silicon.
The layouts, at one scale
Key numbers
Post-layout simulation with extracted parasitics, not silicon.
| 65 nm bulk CMOS | 22 nm FD-SOI | 16 nm FinFET | basis | |
|---|---|---|---|---|
| Area | 1125 µm² (25.42 × 44.26 µm) | 977 µm² (43.60 × 22.40 µm) | 407 µm² (22.00 × 18.48 µm) | drawn macro outline |
| Supply | 1.2 V | 0.8 V core, 1.8 V I/O devices | 0.8 V core, 1.8 V I/O devices | |
| Temperature error, typical ¹ | ±0.056 °C | ±0.332 °C | ±0.011 °C | tt, nominal supply |
| Temperature error, worst case ² | ±0.070 °C | ±0.394 °C (worst-case model ±0.429 °C) | ±0.095 °C ³ | corners, supply ±5 %, Monte Carlo |
| Power while on ⁴ | 20.5–25.6 µW | 41.8–61.1 µW | 42.6–61.8 µW | over the conditions |
¹ 0 to 85 °C after a two-point calibration at 0 and 85 °C; specification ±1 °C. ² Worst case over process corners, supply ±5 % and Monte Carlo; 22 nm: best-case mismatch model, the design basis. ³ 16 nm: Monte Carlo on the schematic. ⁴ Includes the 10 µA bias (22 / 16 nm: and the output buffer). In 22 and 16 nm the sensor uses 1.8 V I/O devices and a follower output: the PNP needs more than the 0.8 V core supply at 0 °C.
The original sign-off summary above retains its stated simulation and mismatch-model basis. The expanded Results and Monte Carlo pages report the subsequent 200-chip extracted-layout characterization for all three technologies.
Characterization
Post-layout characterization of the signed-off layouts in the three technologies: tt, 27 °C, nominal supply unless a caption says otherwise. Post-layout simulation with extracted parasitics, not silicon.
| Quantity | 65 nm CMOS | 22 nm FD-SOI | 16 nm FinFET | Basis |
|---|---|---|---|---|
| Area (drawn macro) | 1125 µm² | 977 µm² | 407 µm² | post-layout |
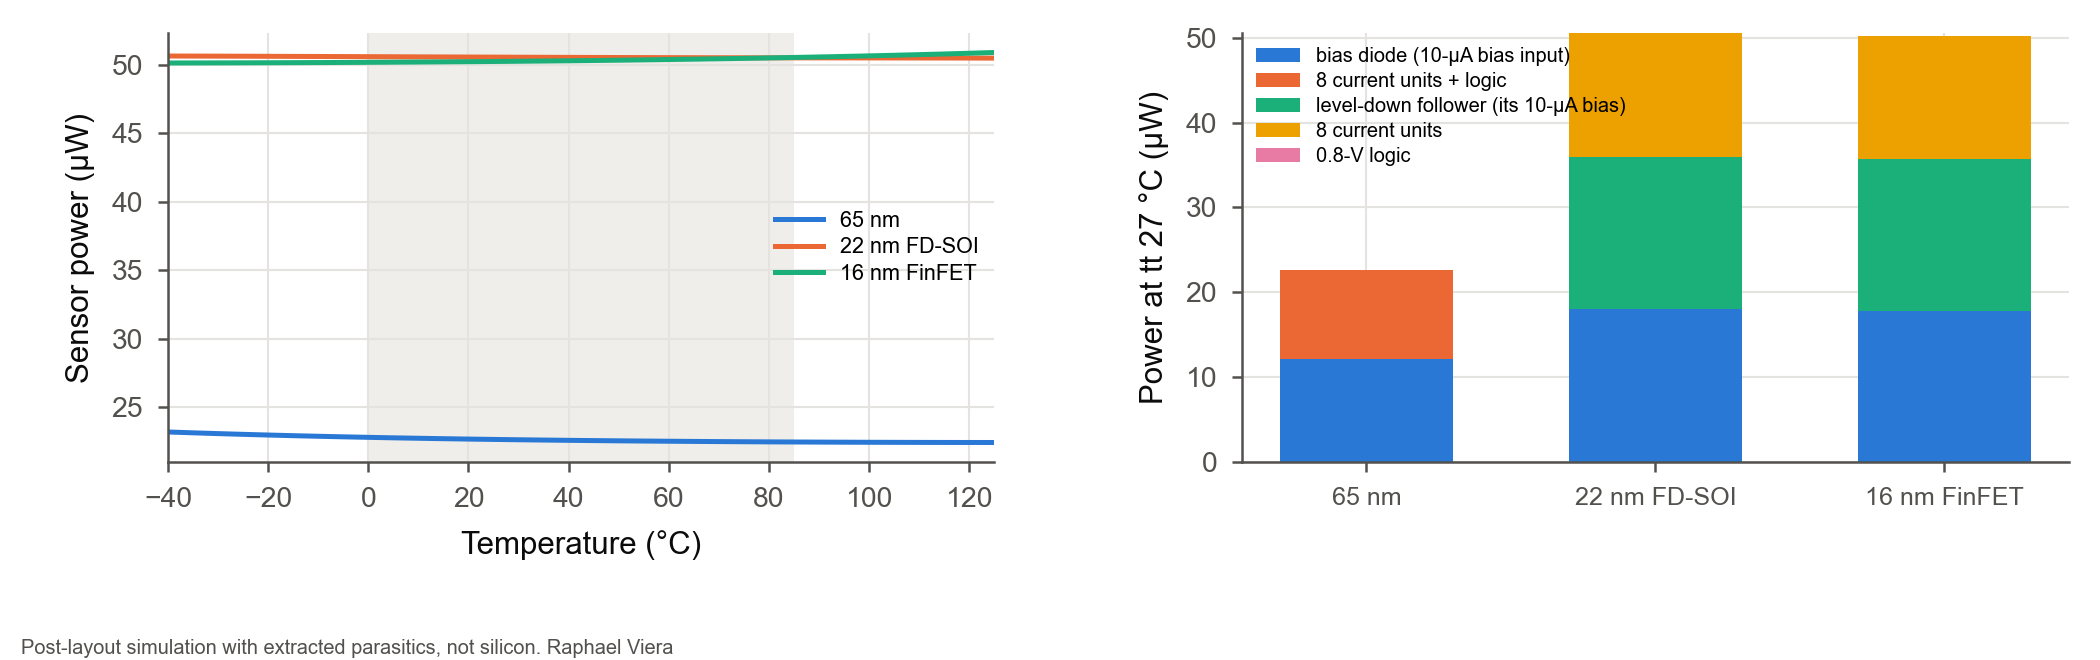
| Power, sensor incl. its 10-µA bias diode (22 / 16 nm + the 10-µA follower), tt 27 °C | 22.6 µW | 50.6 µW | 50.3 µW | post-layout |
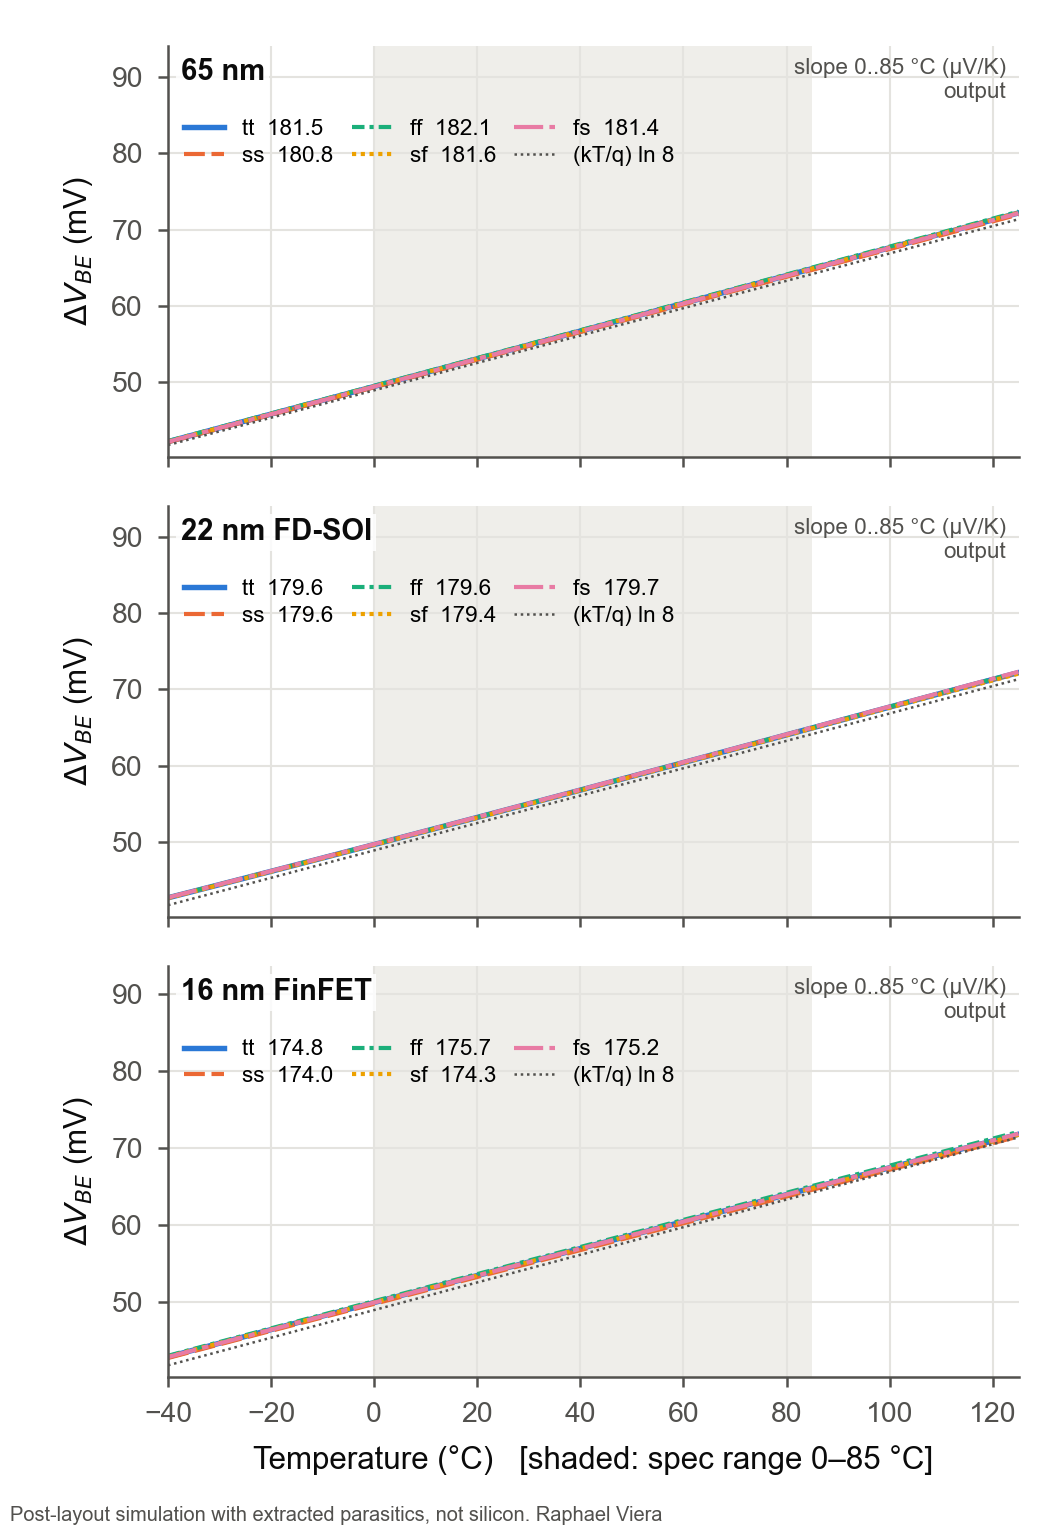
| ΔVBE at 27 °C / slope 0..85 °C | 54.34 mV / 181.5 µV/K | 54.51 mV / 179.6 µV/K | 54.65 mV / 174.8 µV/K | post-layout |
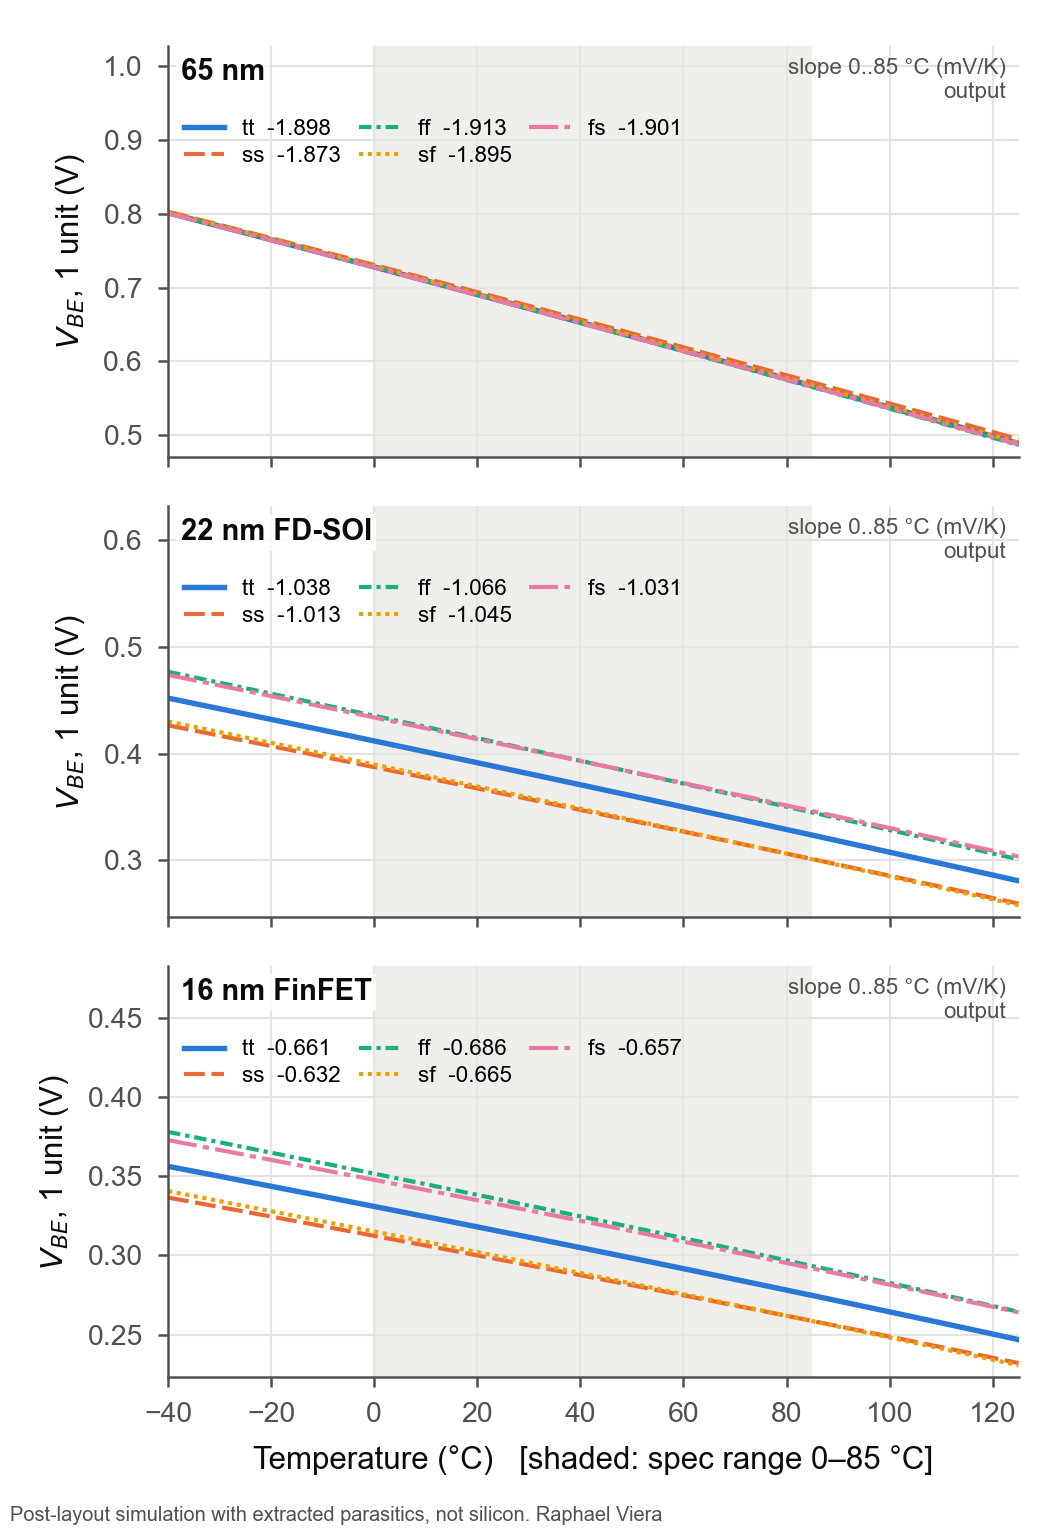
| VBE (1 unit) at 27 °C / slope | 0.6776 V / -1.898 mV/K | 0.3843 V / -1.038 mV/K | 0.3134 V / -0.661 mV/K | post-layout |
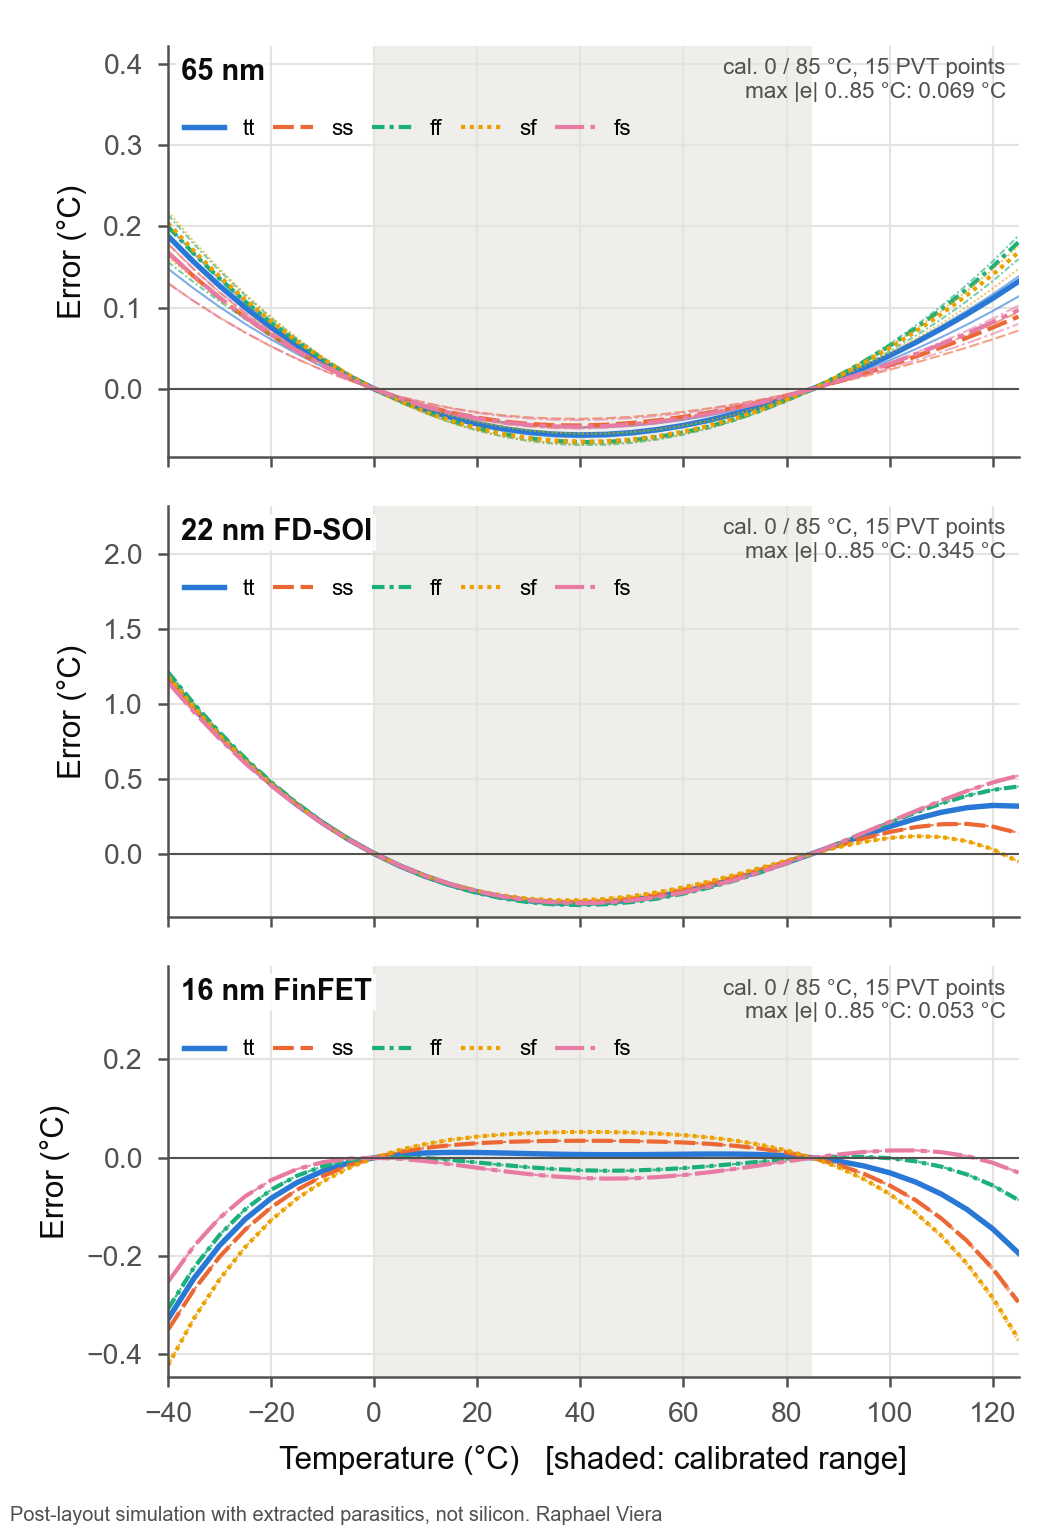
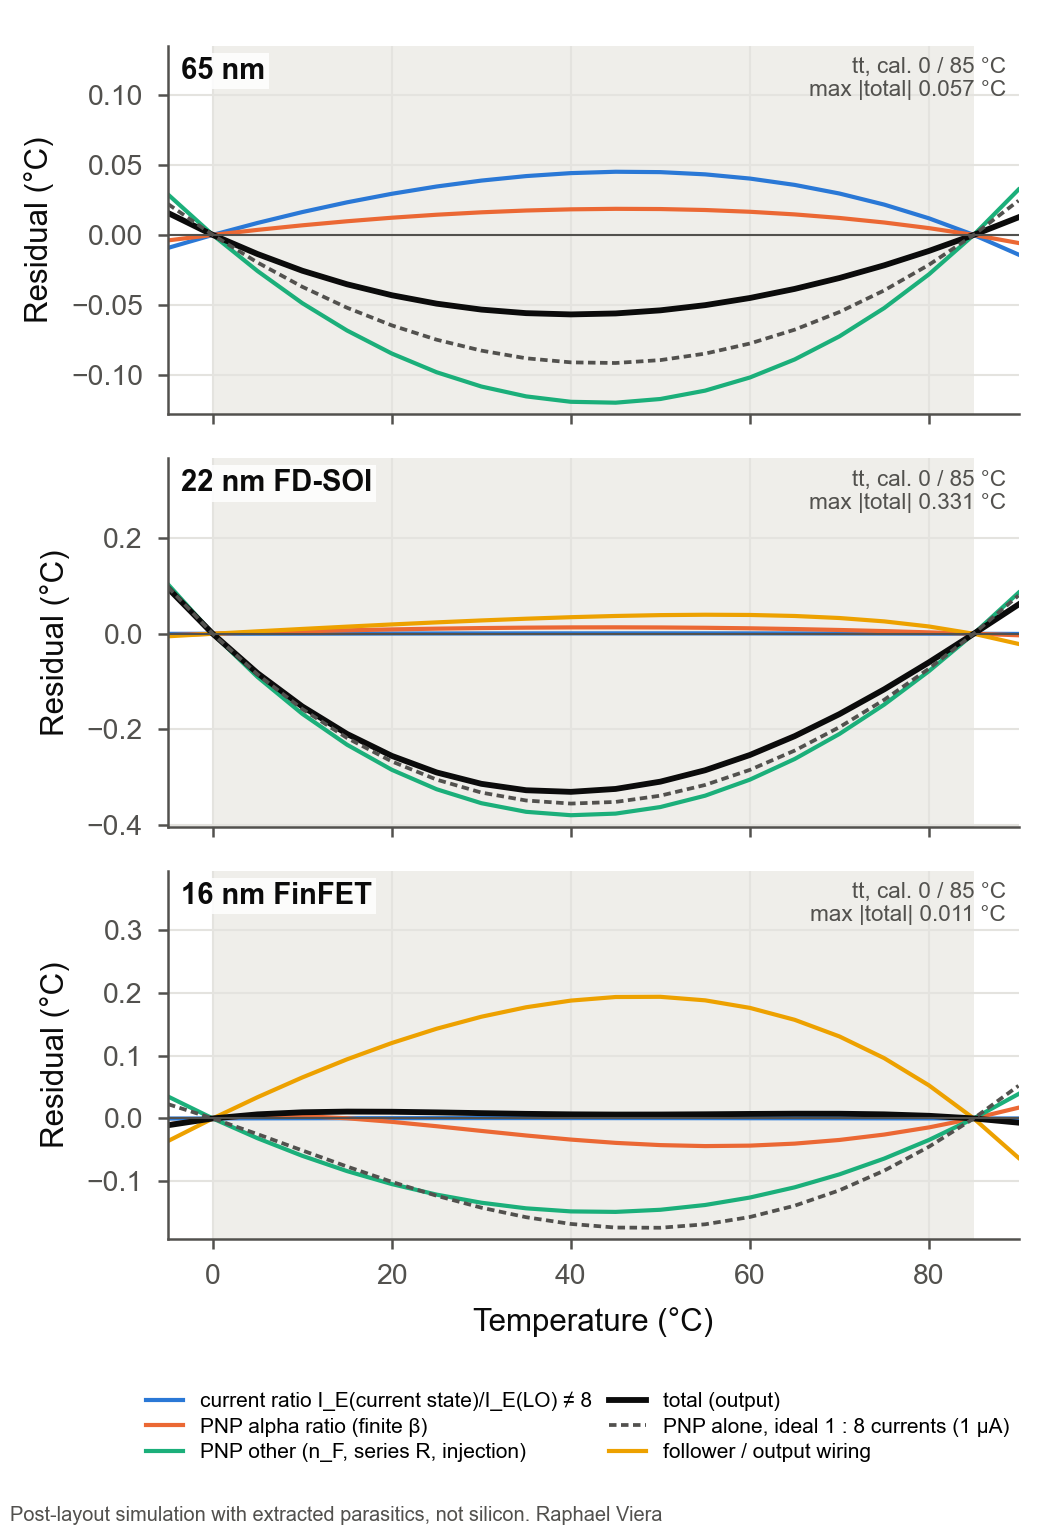
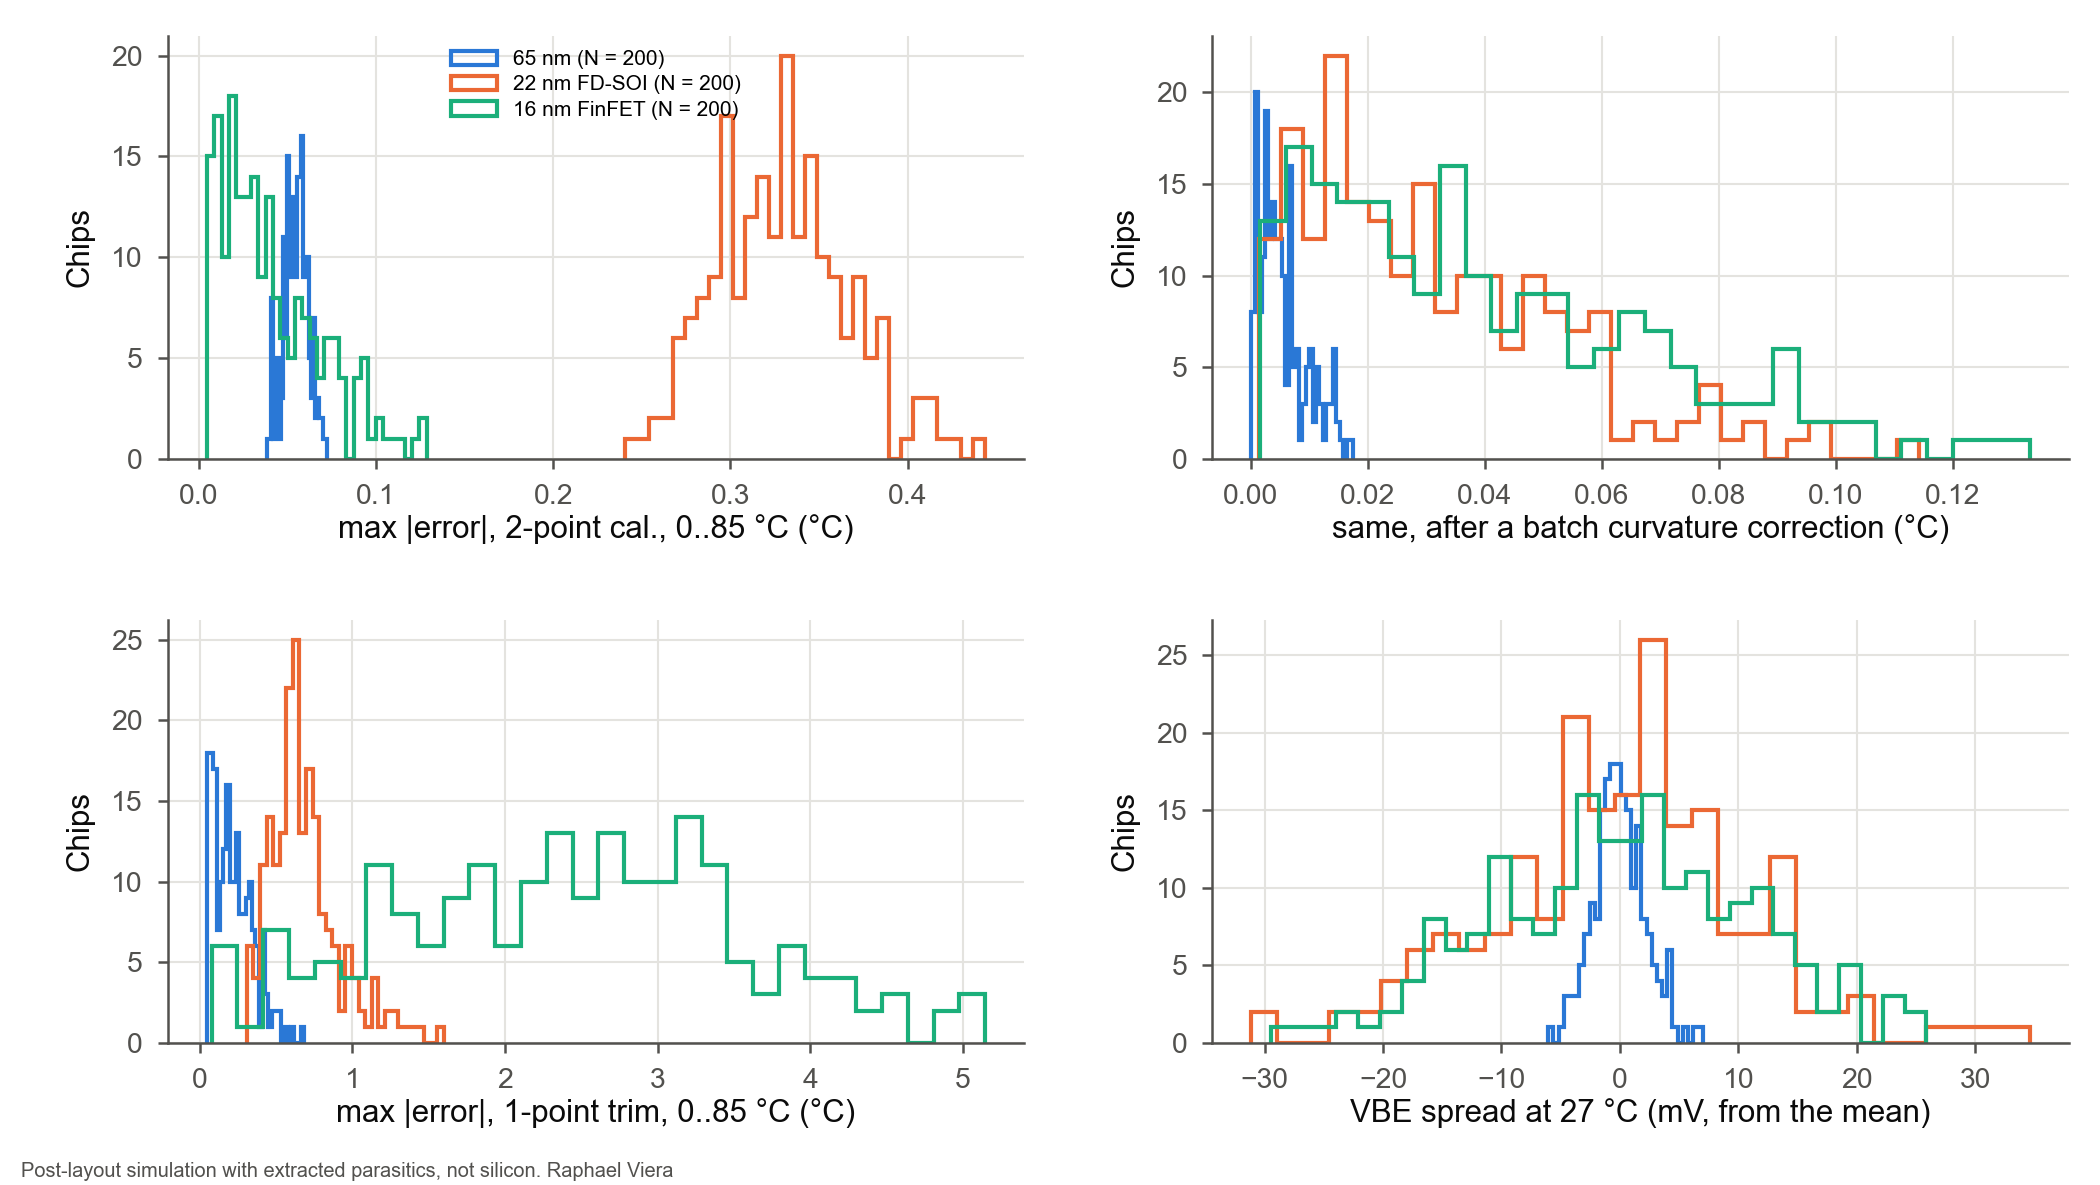
| Error after a 2-point calibration (0 / 85 °C), 0..85 °C: tt / worst of 15 PVT points | ±0.057 / ±0.069 °C | ±0.331 / ±0.345 °C | ±0.011 / ±0.053 °C | post-layout |
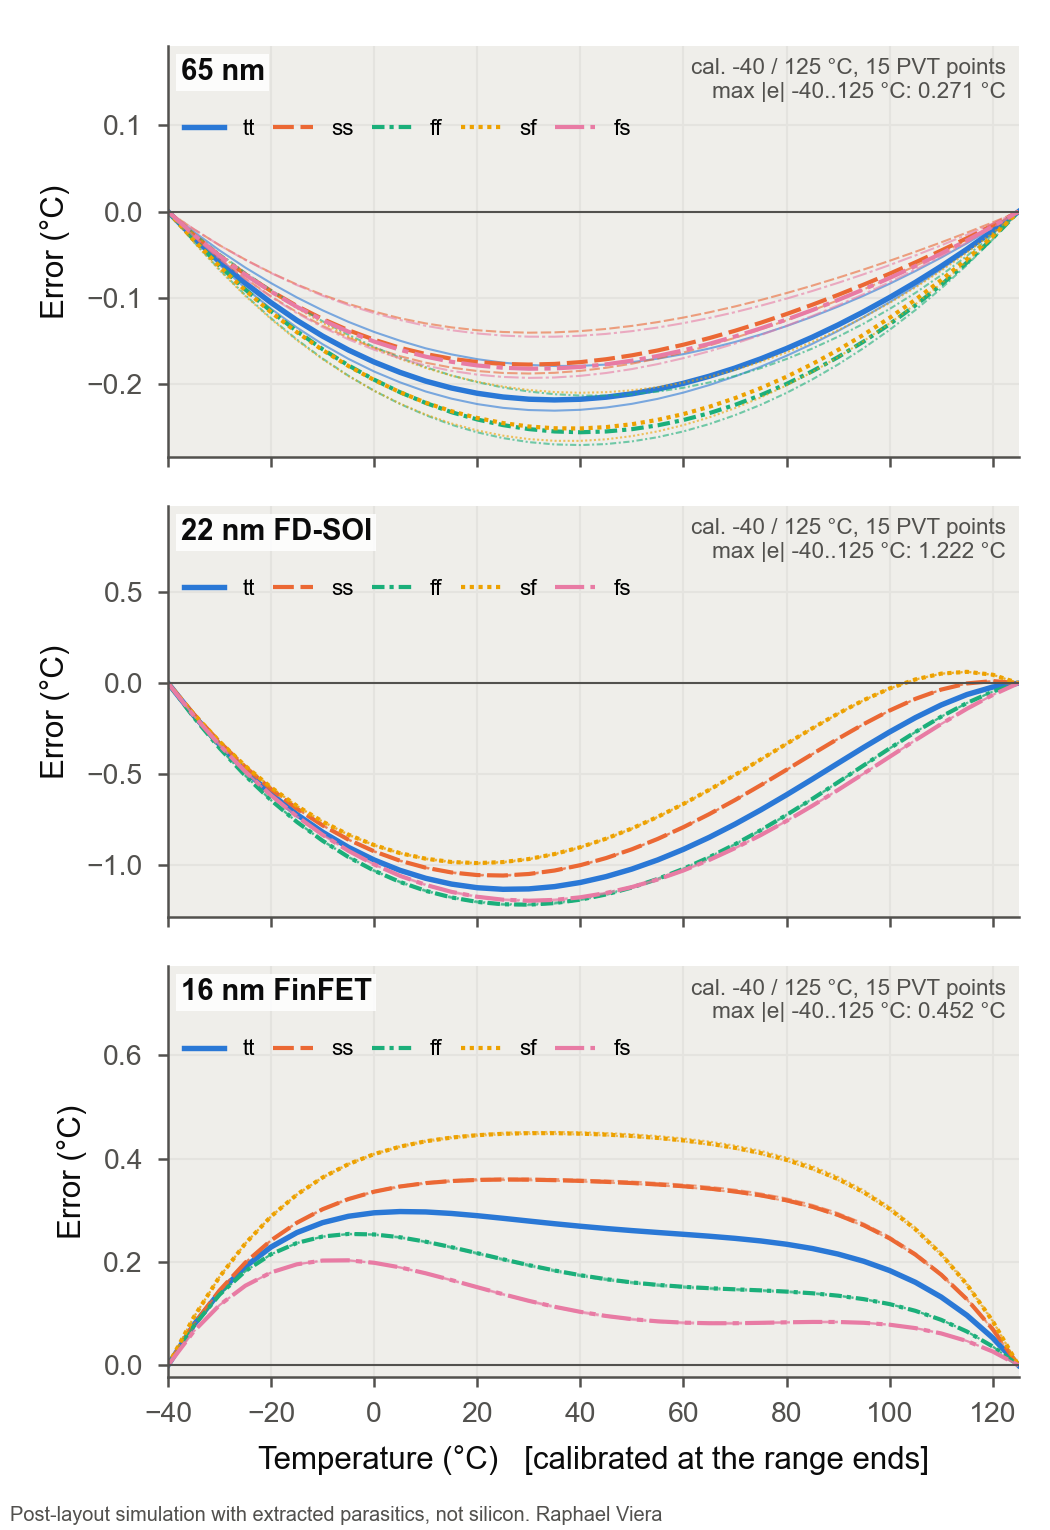
| Same, −40..125 °C, calibrated at −40 / 125 °C: tt / worst PVT | ±0.218 / ±0.271 °C | ±1.135 / ±1.222 °C | ±0.298 / ±0.452 °C | post-layout |
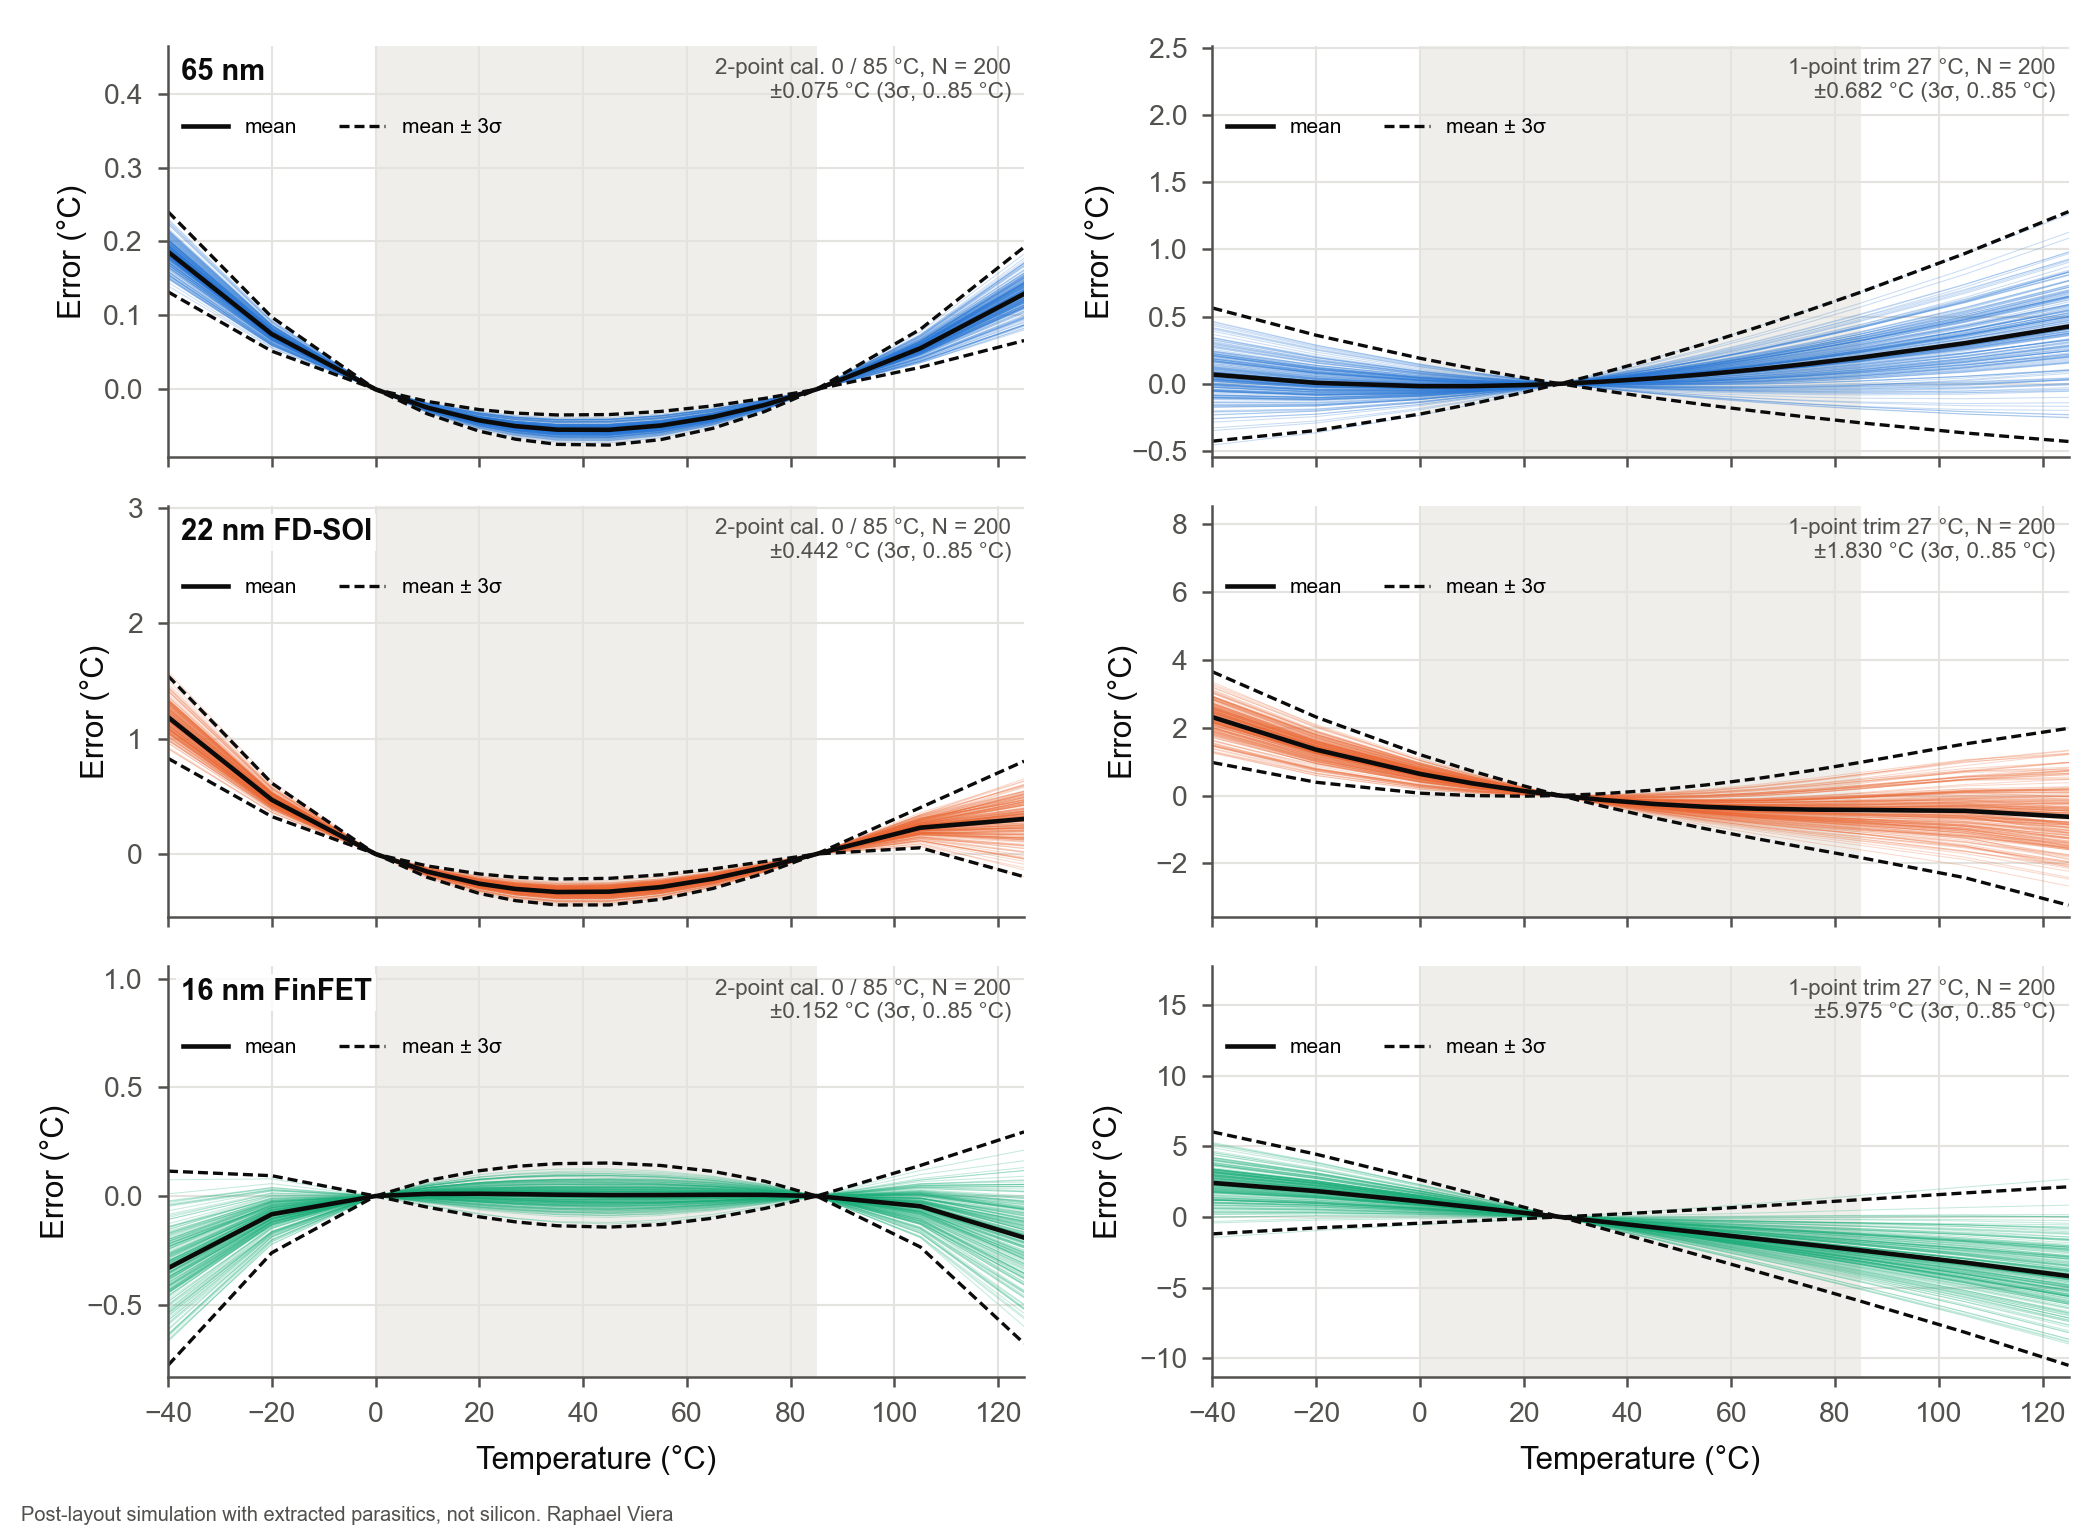
| Monte Carlo (process + mismatch, 200 chips): inaccuracy, 2-point cal., 0..85 °C (3σ) | ±0.075 °C | ±0.442 °C | ±0.152 °C | post-layout |
| Monte Carlo: inaccuracy, 2-point cal. −40 / 125 °C, −40..125 °C (3σ) | ±0.292 °C | ±1.599 °C | ±0.863 °C | post-layout |
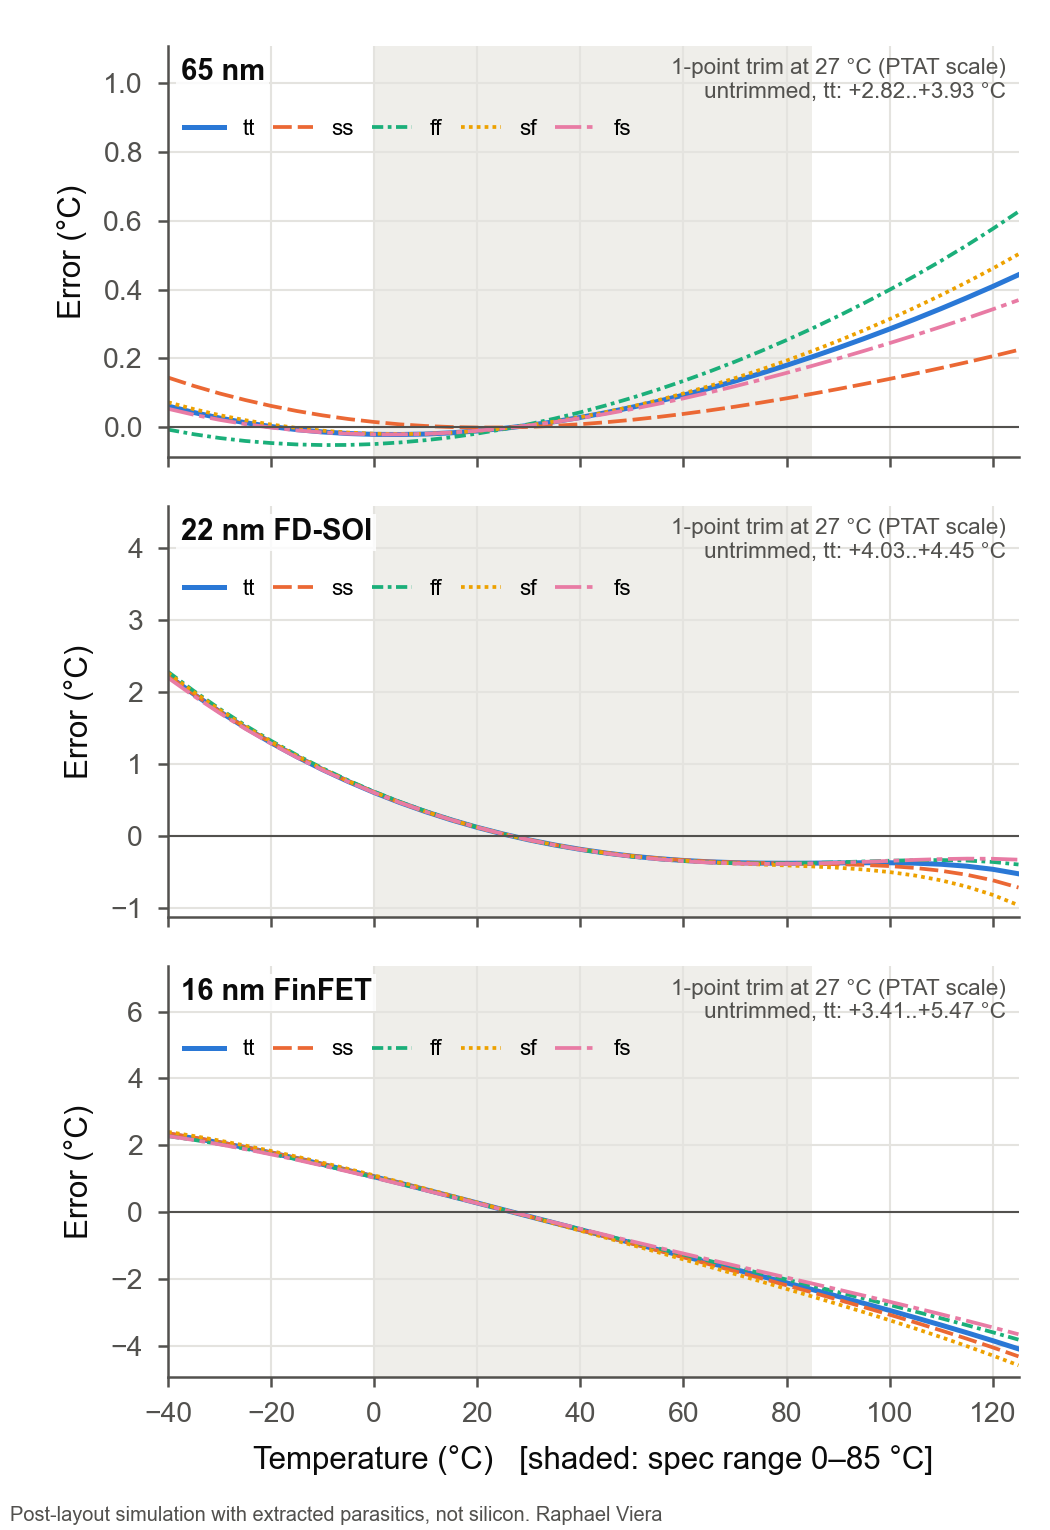
| Monte Carlo: inaccuracy, 1-point trim at 27 °C, 0..85 / −40..125 °C (3σ) | ±0.682 / ±1.280 °C | ±1.830 / ±3.645 °C | ±5.975 / ±10.511 °C | post-layout |
| Monte Carlo: untrimmed, T = q ΔVBE / (k ln 8), at 27 °C: mean ± 3σ | 3.13 ± 4.17 °C | 4.42 ± 10.24 °C | 5.01 ± 23.19 °C | post-layout |
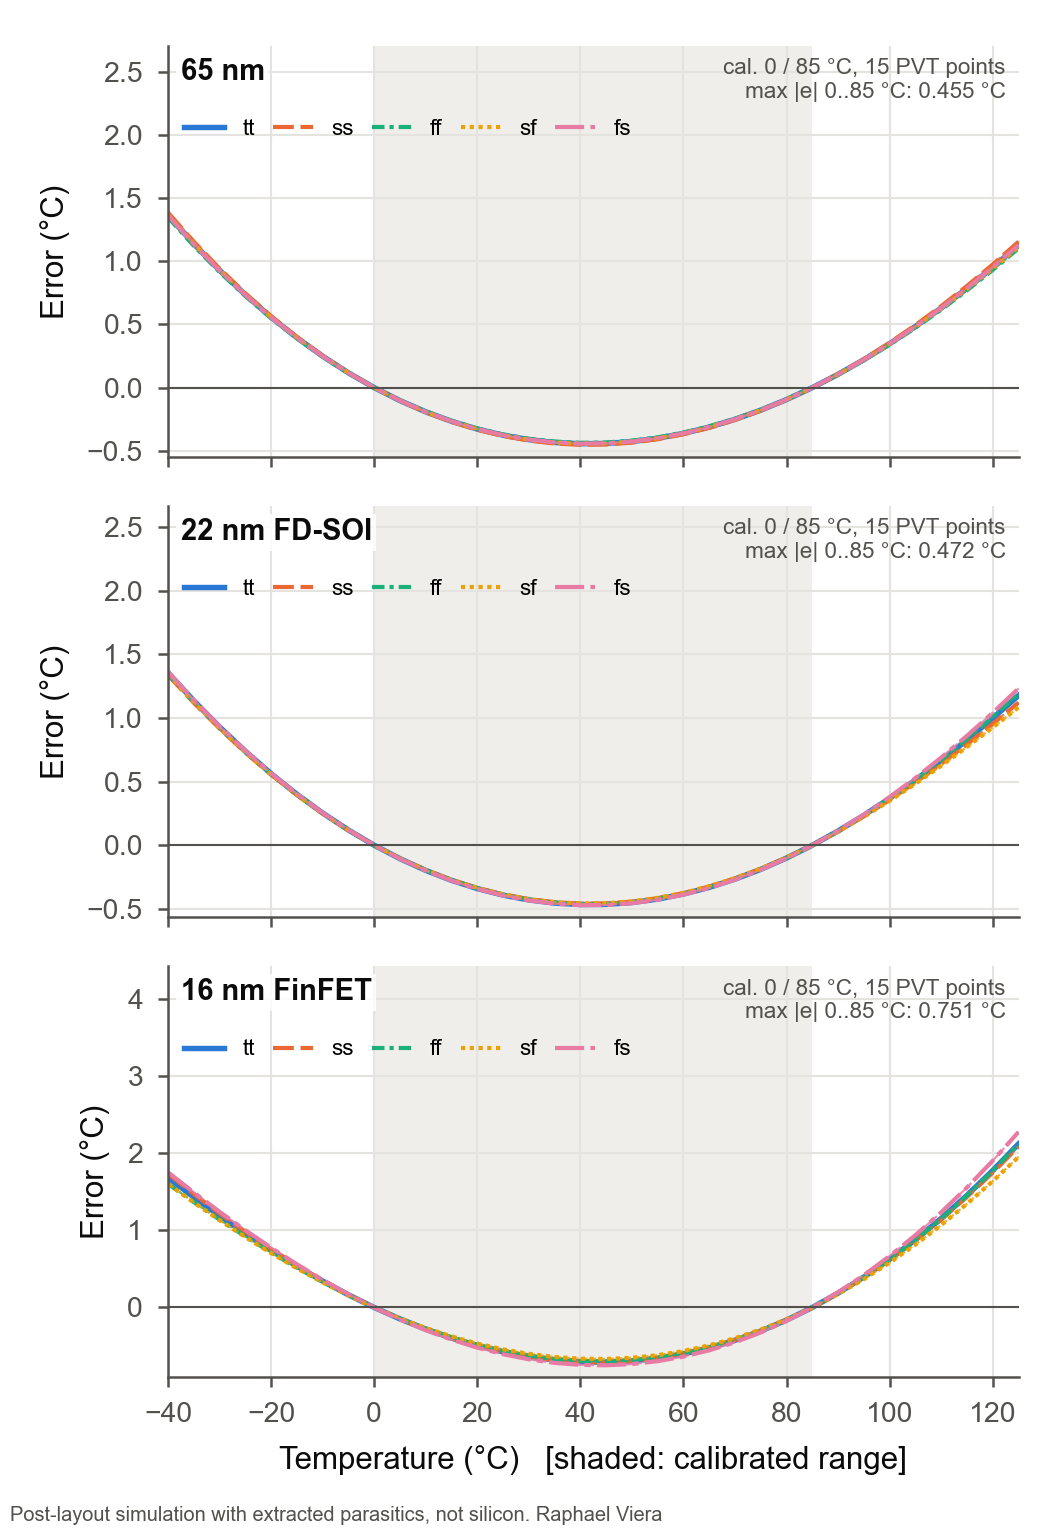
| VBE reading, 2-point cal., 0..85 °C: worst PVT / MC 3σ | ±0.455 / ±0.450 °C | ±0.472 / ±0.501 °C | ±0.751 / ±0.813 °C | post-layout |
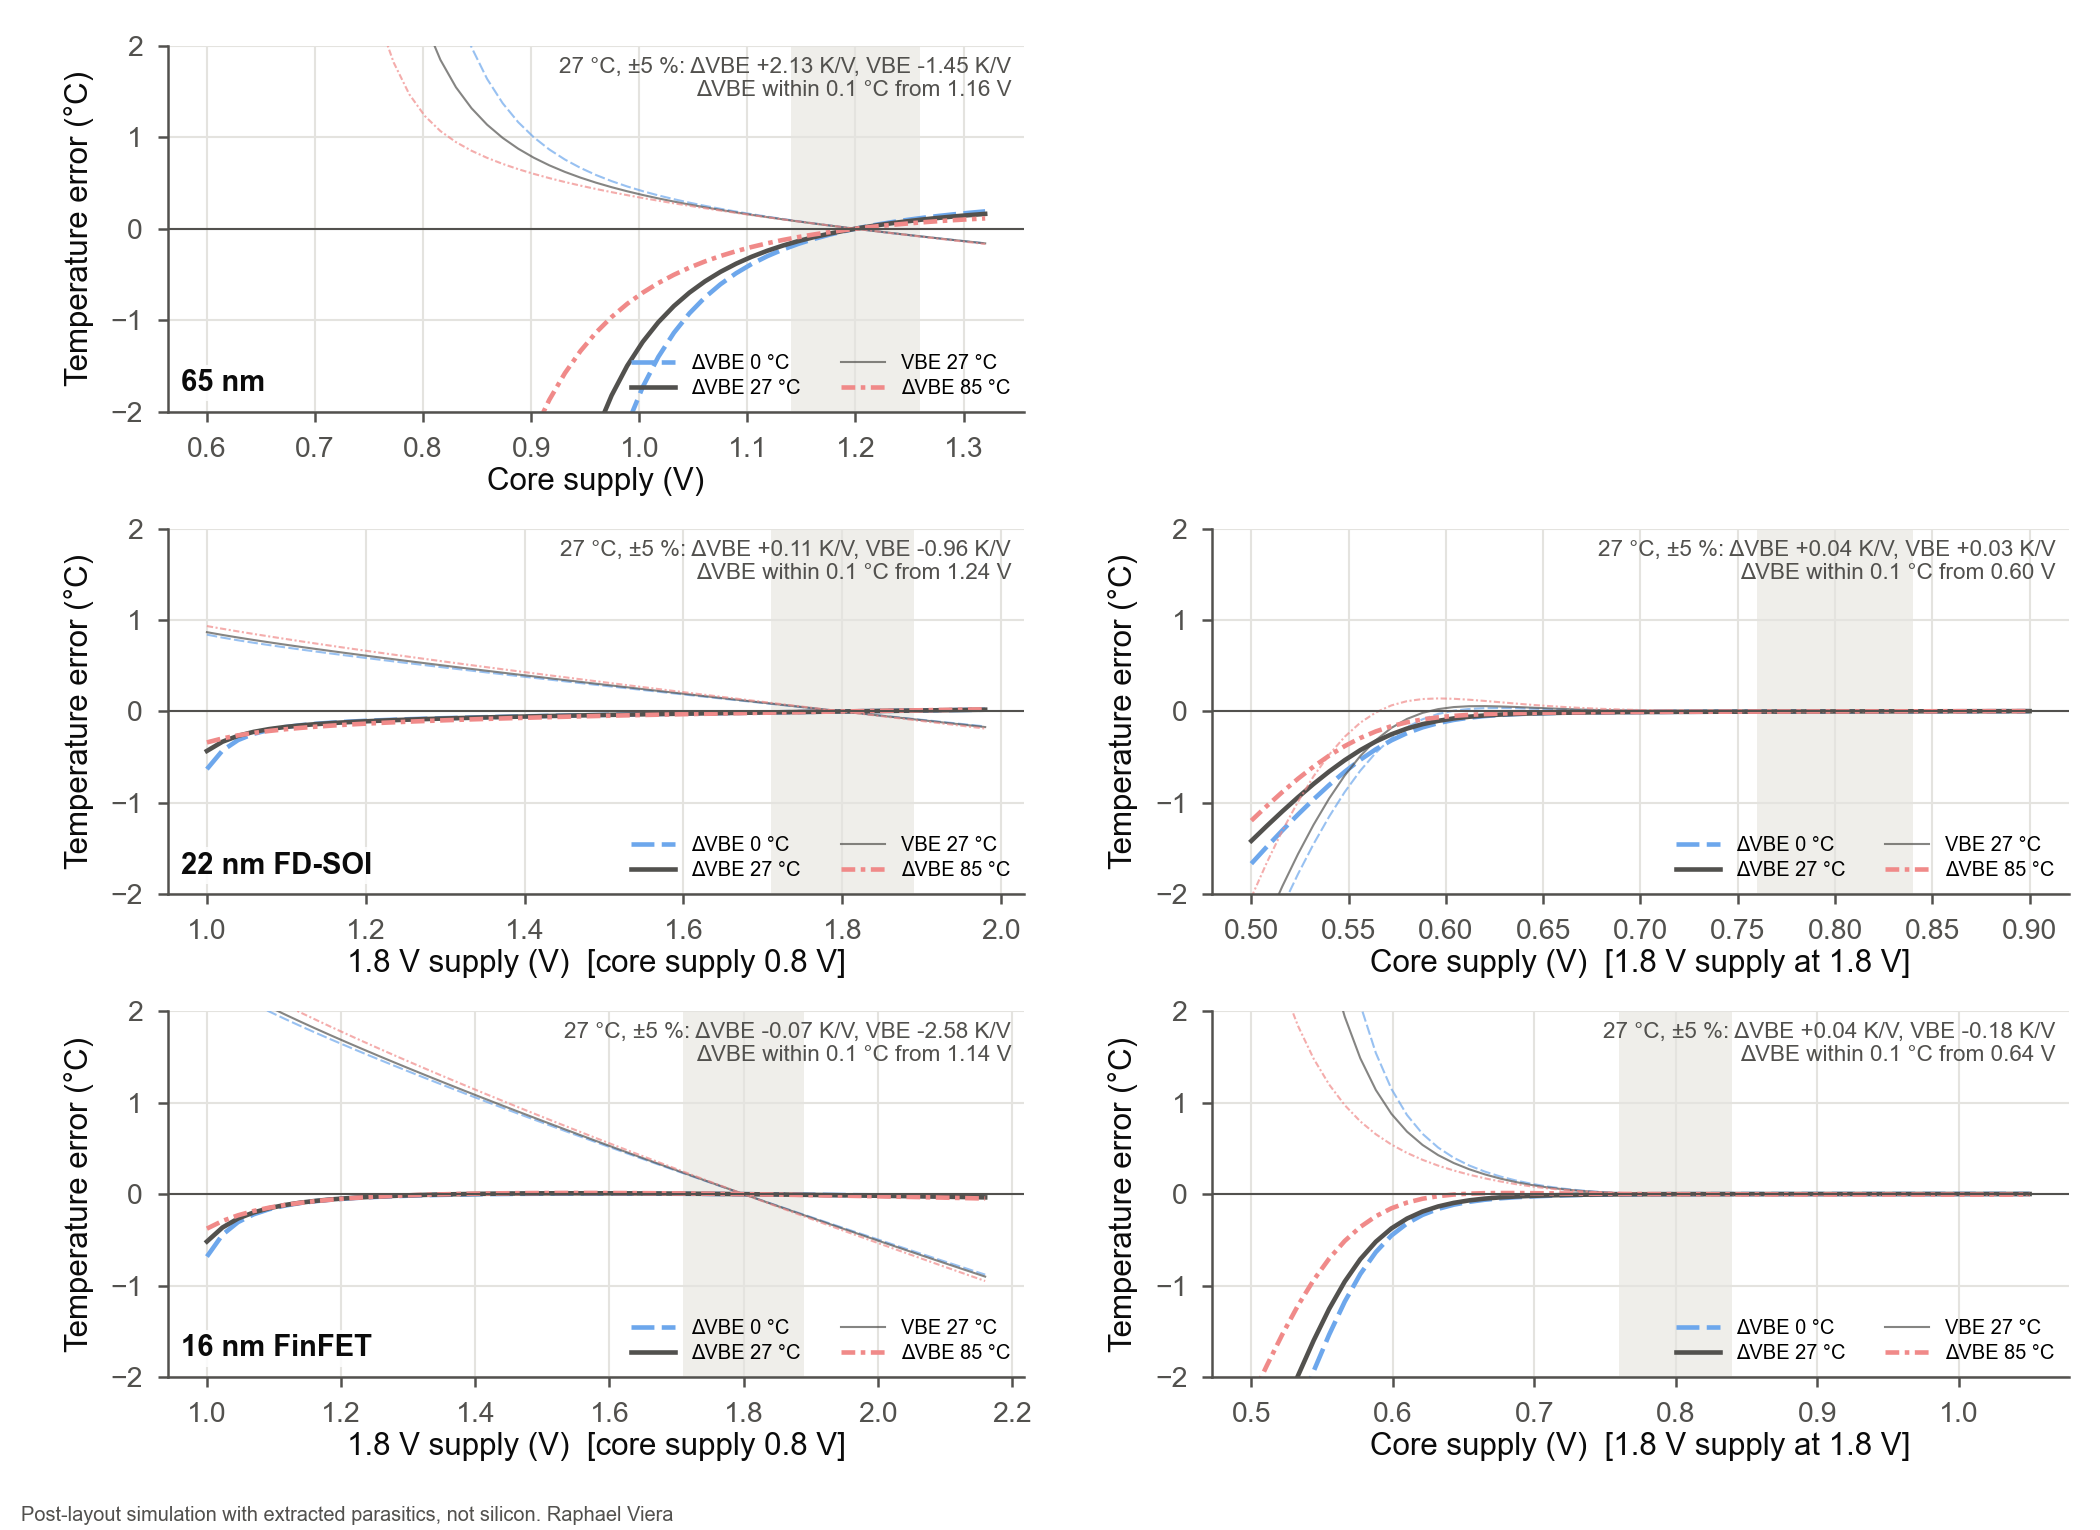
| ΔVBE supply sensitivity at 27 °C (±5 % fit) | 2.132 K/V | 0.112 K/V (1.8 V supply); 0.039 K/V (core supply) | -0.071 K/V (1.8 V supply); 0.036 K/V (core supply) | post-layout |
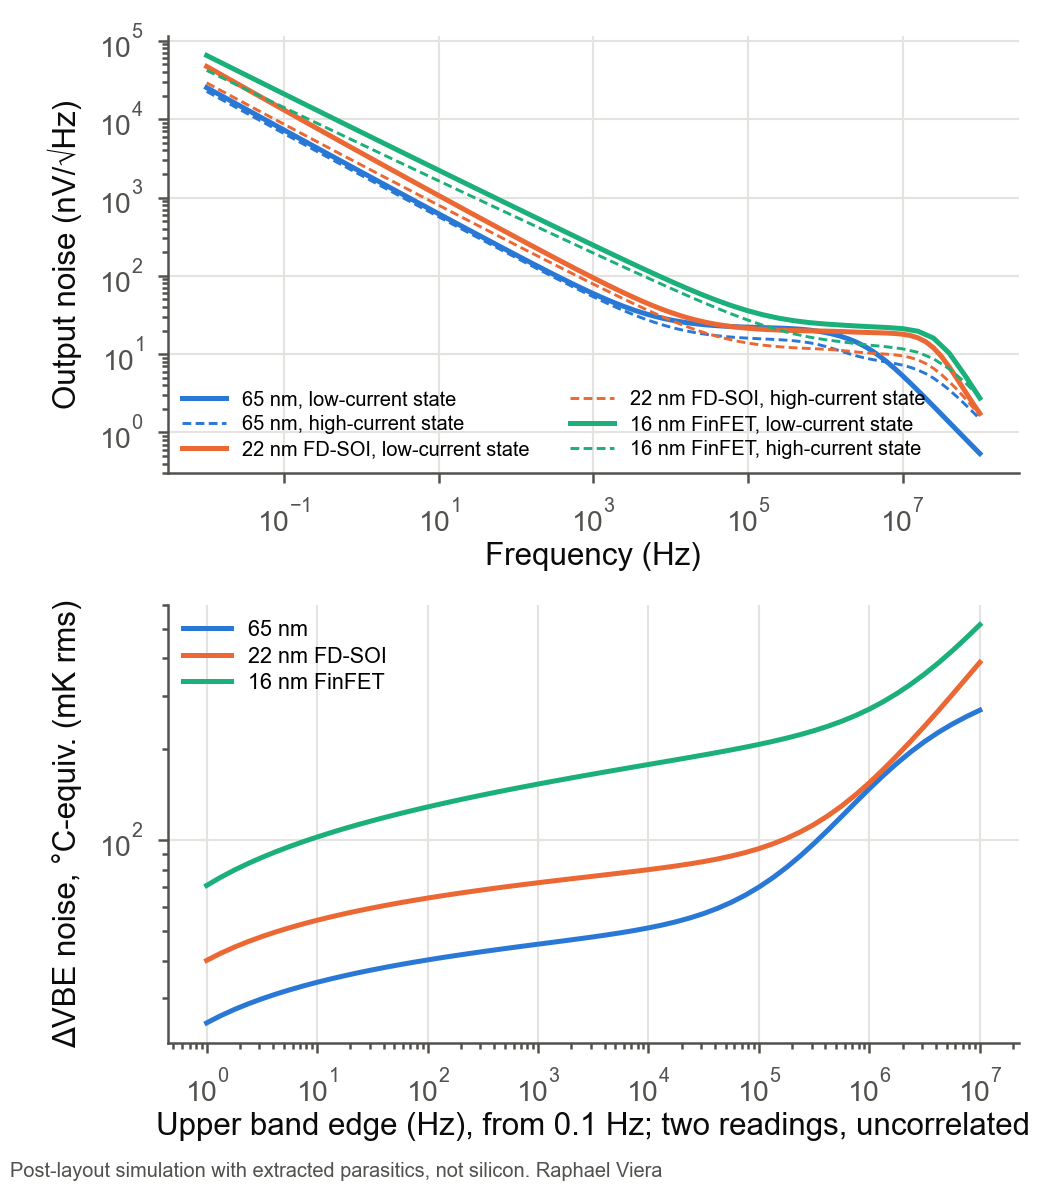
| Noise of one ΔVBE measurement, 0.1 Hz–1 kHz (two readings, uncorrelated) | 45 mK rms | 72 mK rms | 153 mK rms | post-layout |
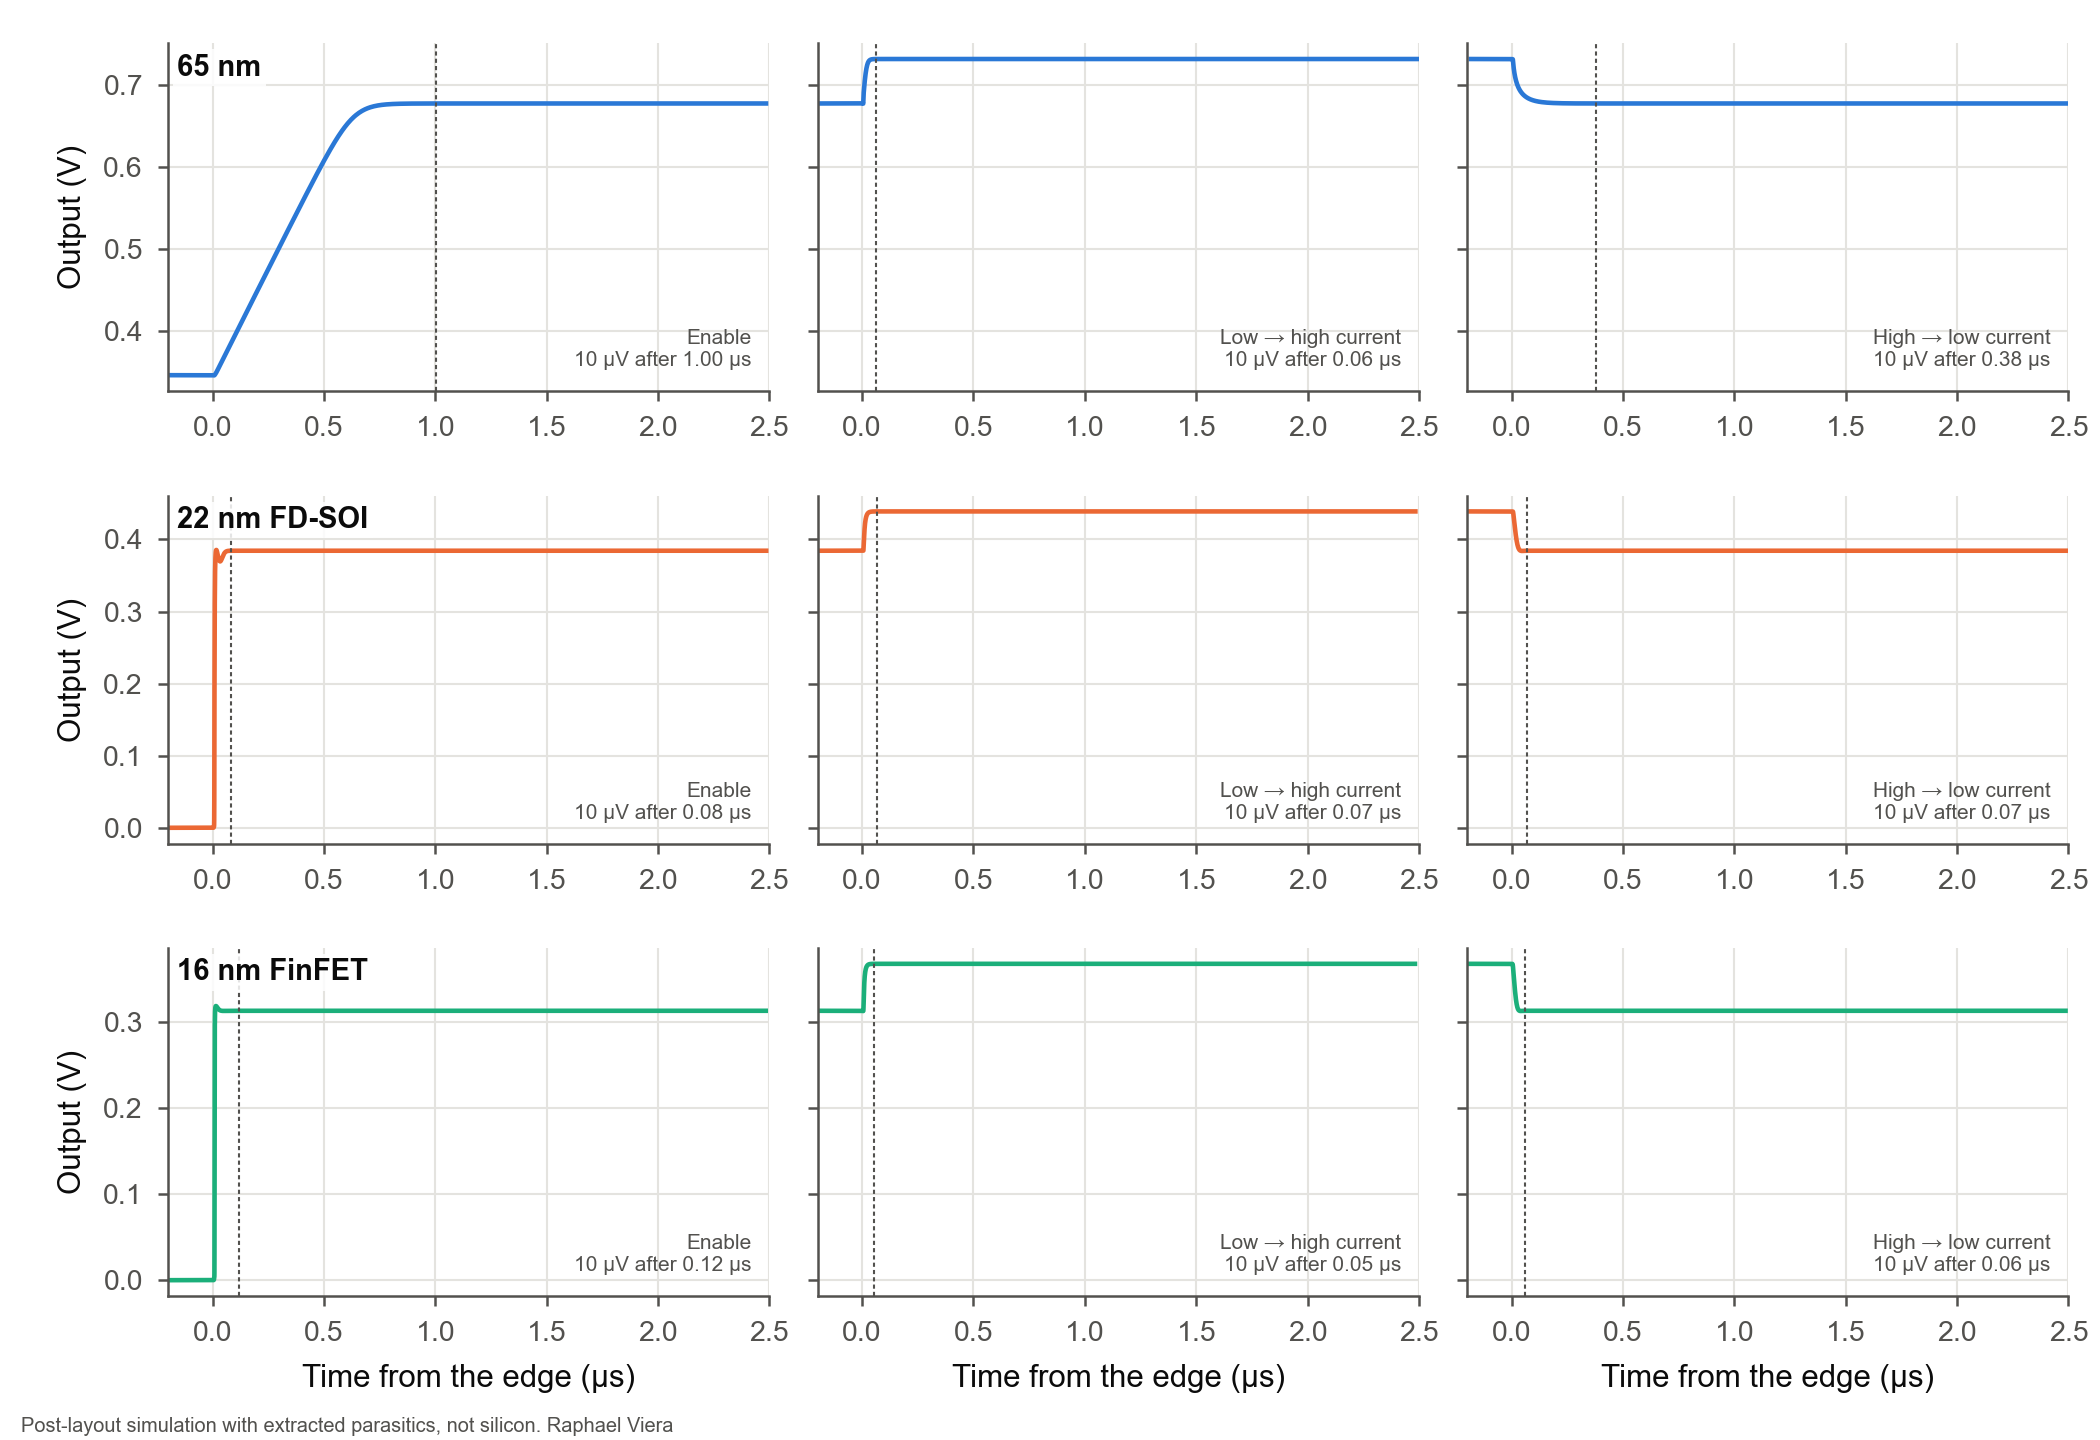
| Settling to 10 µV after enable / after a current-state change, tt | 1.00 / 0.38 µs | 0.08 / 0.07 µs | 0.12 / 0.06 µs | post-layout |
| PNP forward β at 1 unit, 27 °C (in circuit) | 1.02 | 1.52 | 0.66 | post-layout |
ΔVBE and VBE vs temperature (−40..125 °C; spec range 0..85 °C shaded)
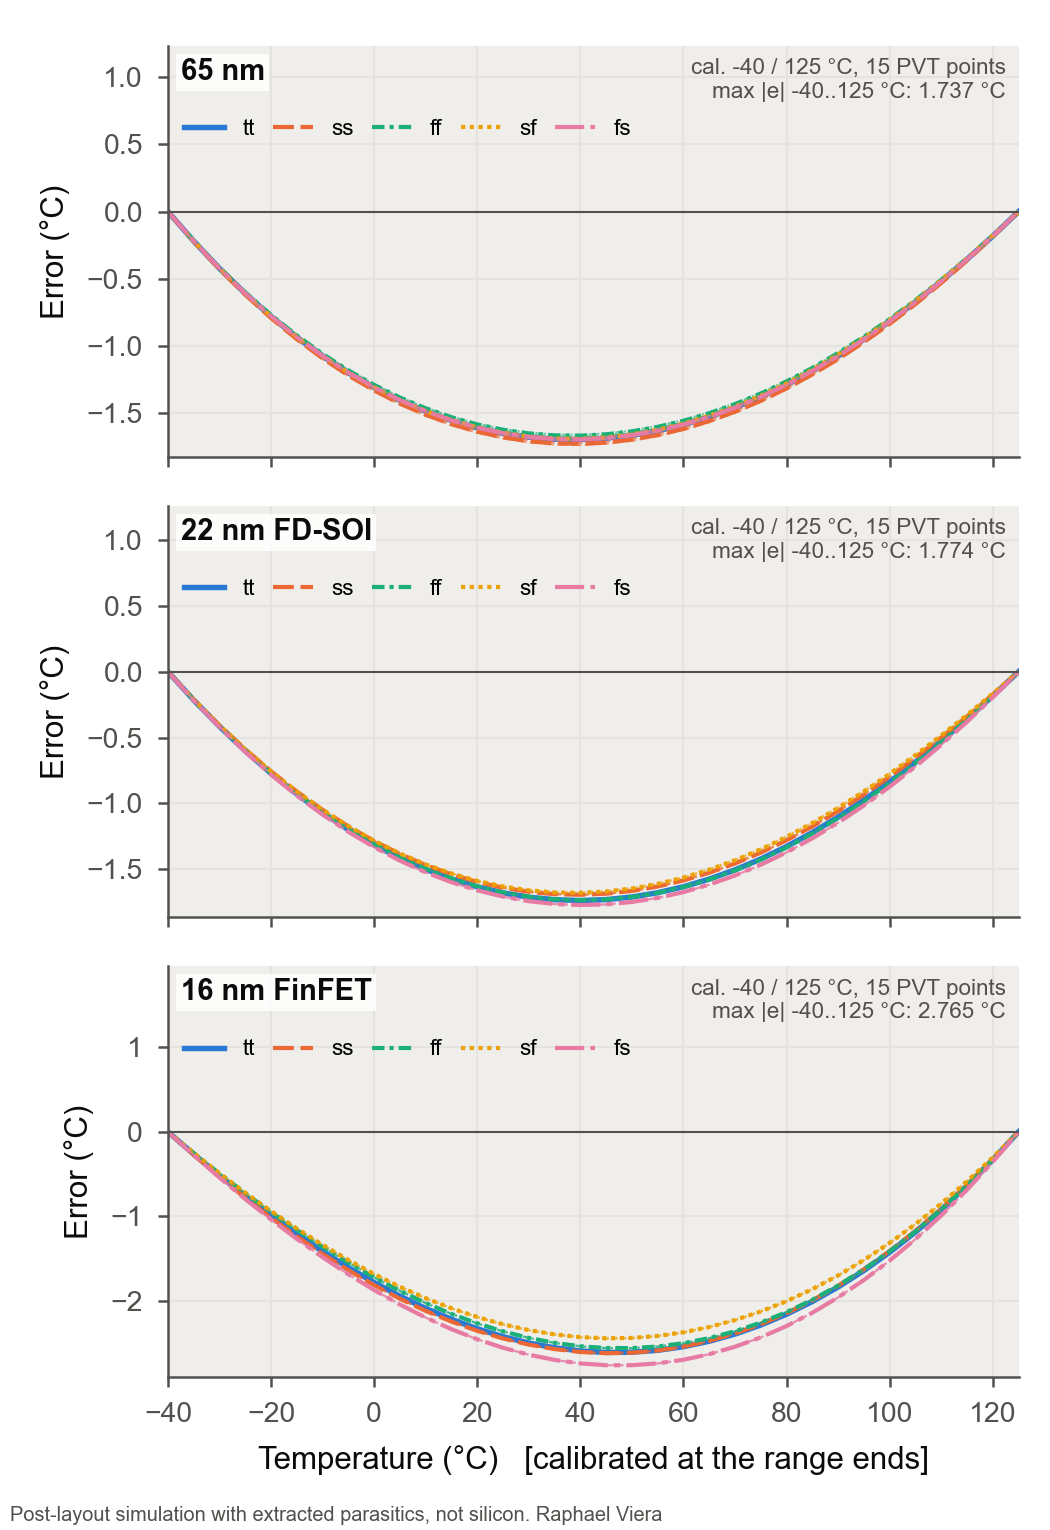
Error after a two-point calibration
One-point trim and untrimmed
Why the calibrated error bows: residual decomposition
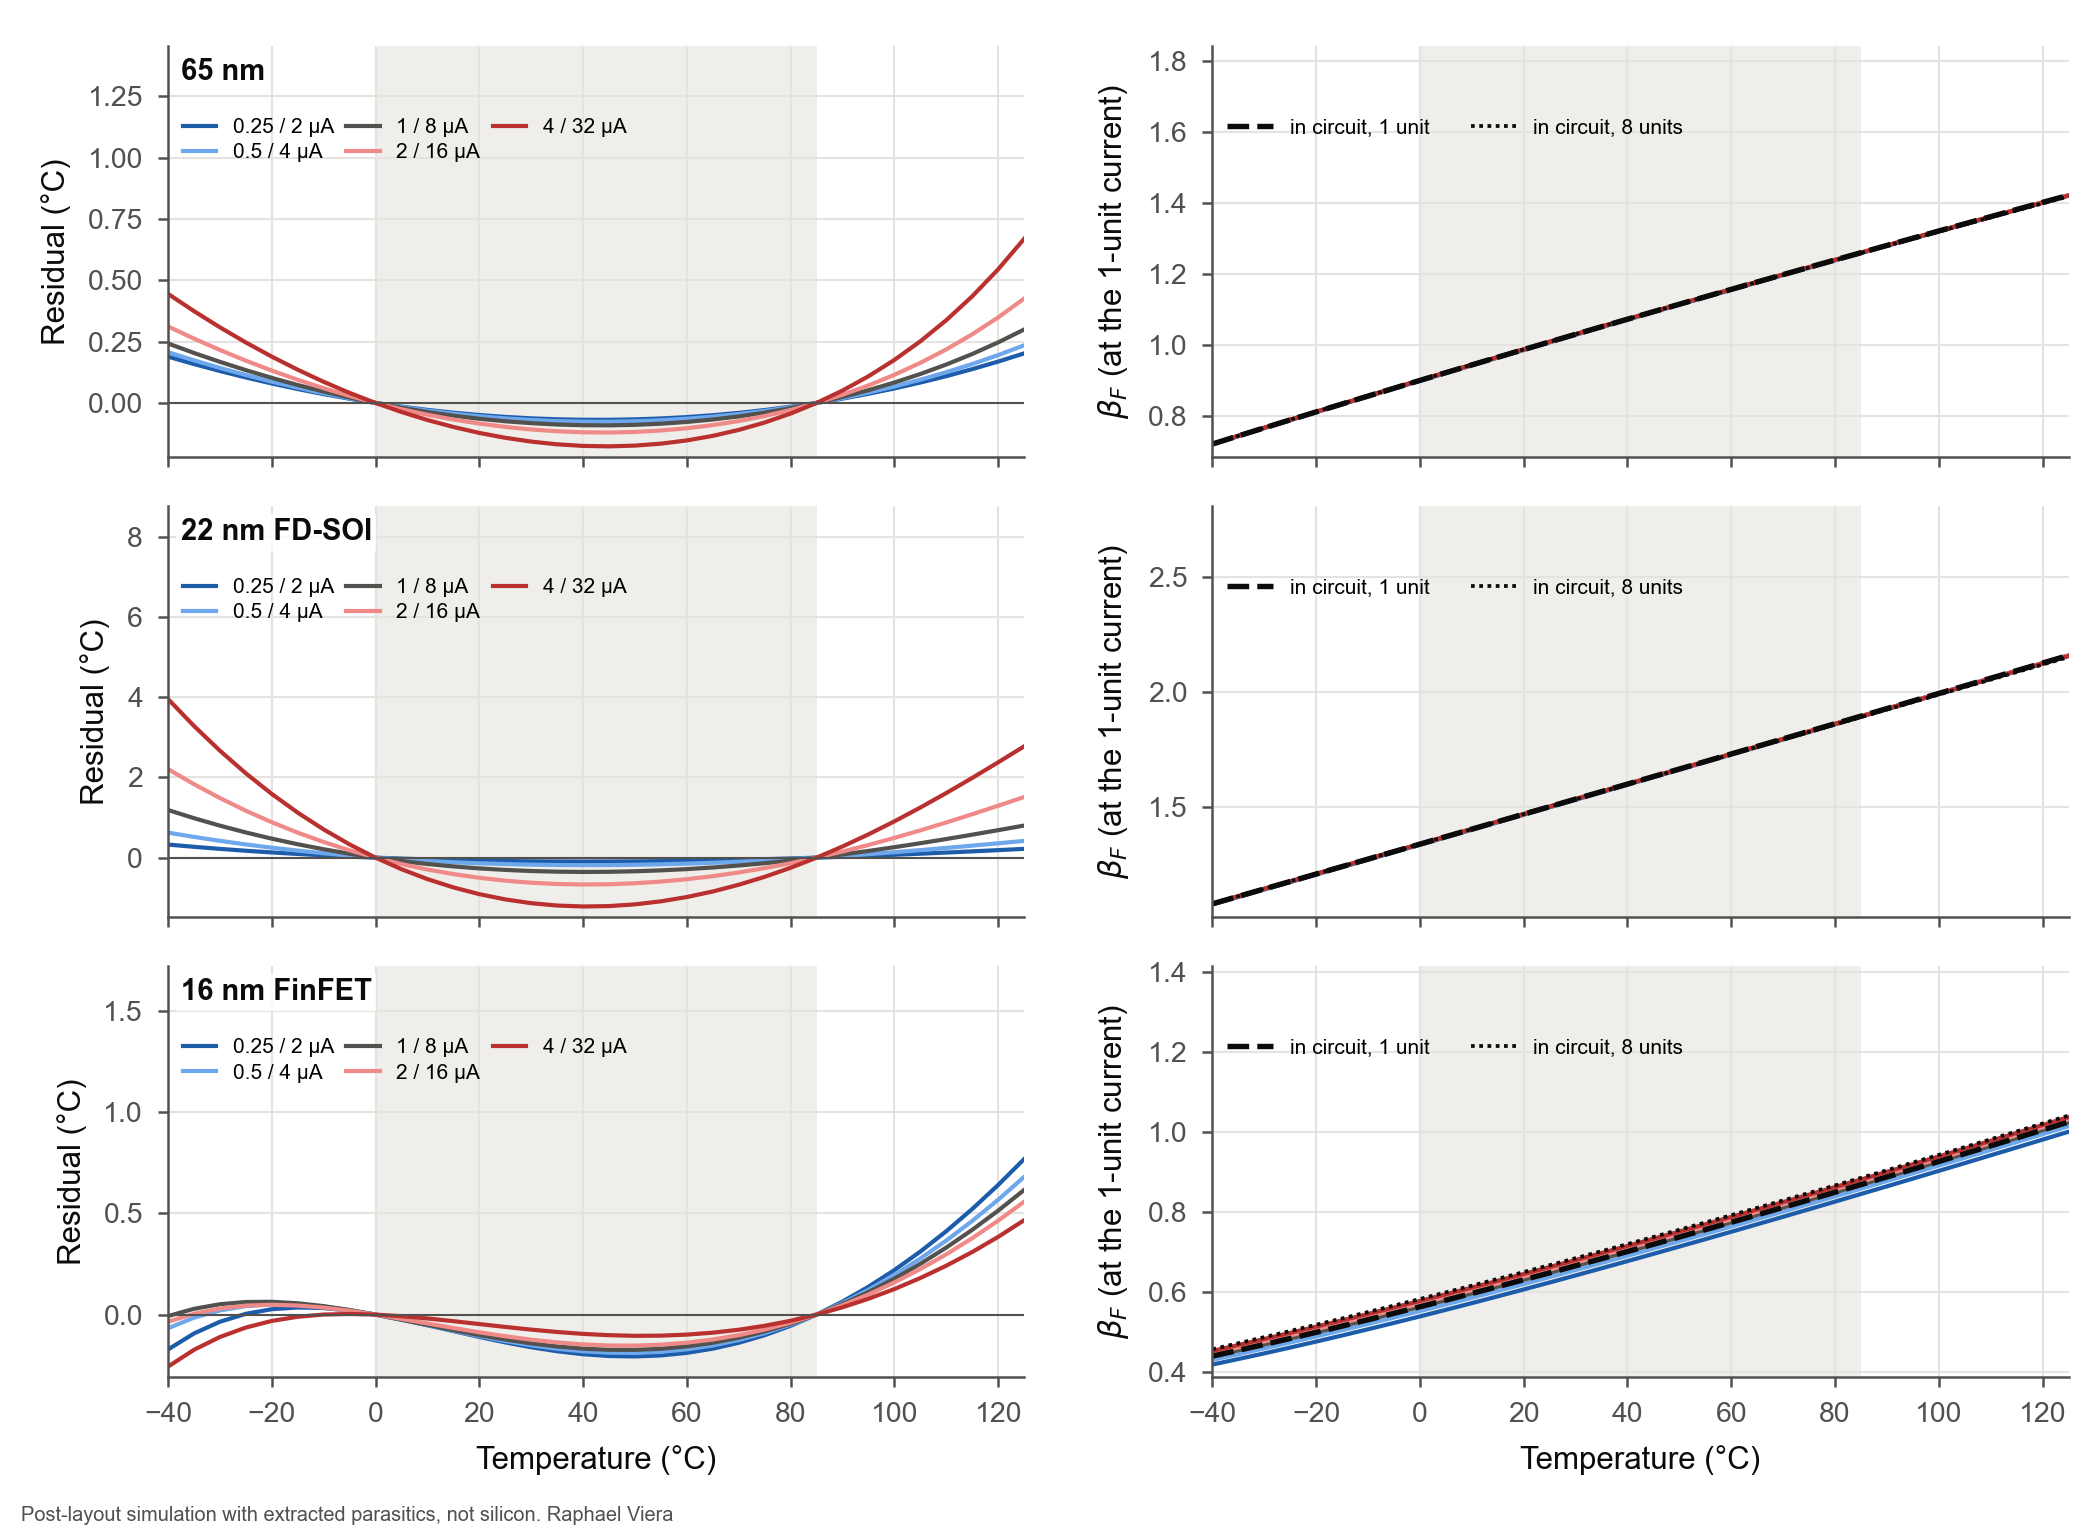
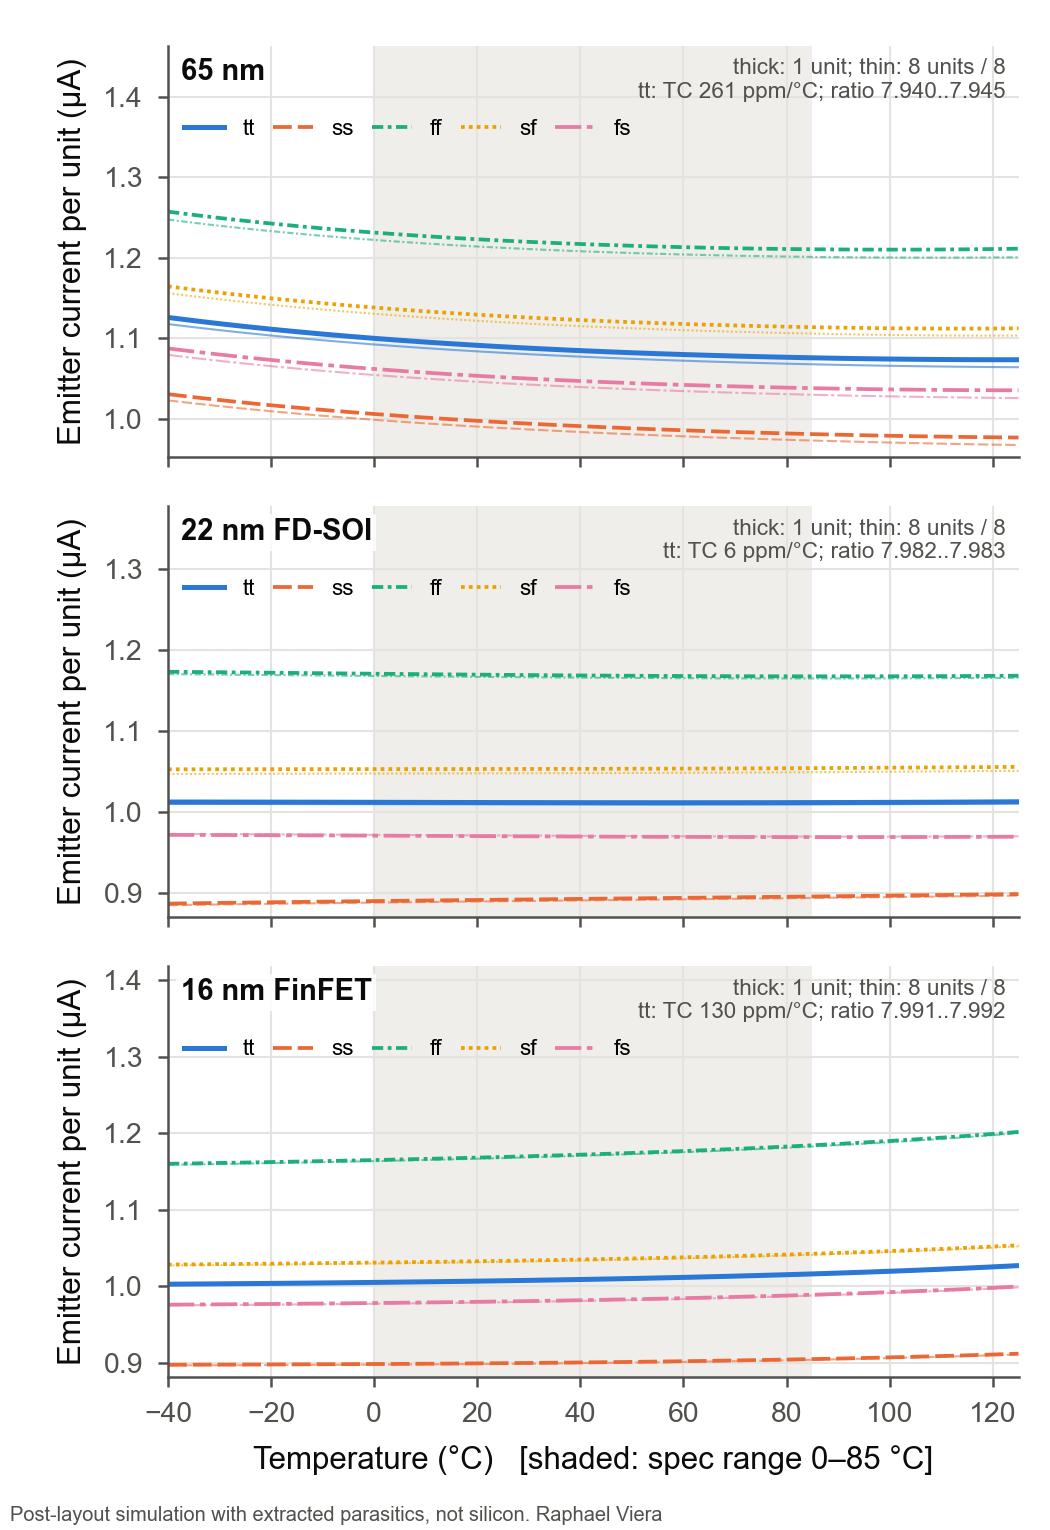
Bias currents vs temperature
Supply dependence (from the oxide limit down)
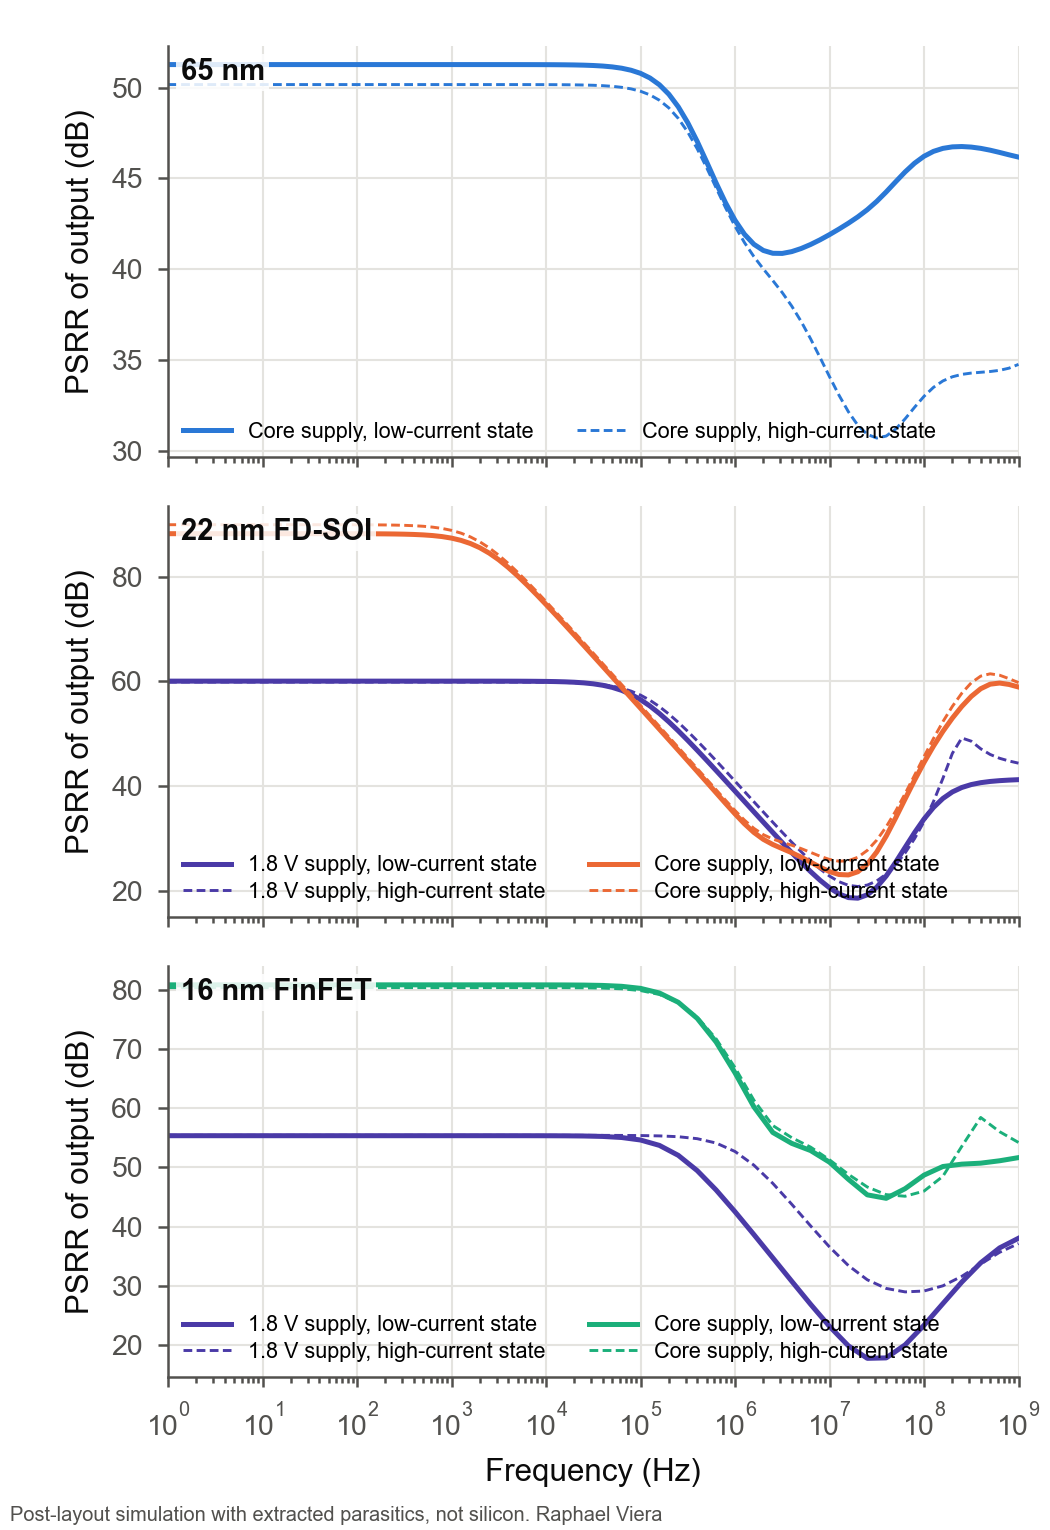
Supply rejection vs frequency
Output noise
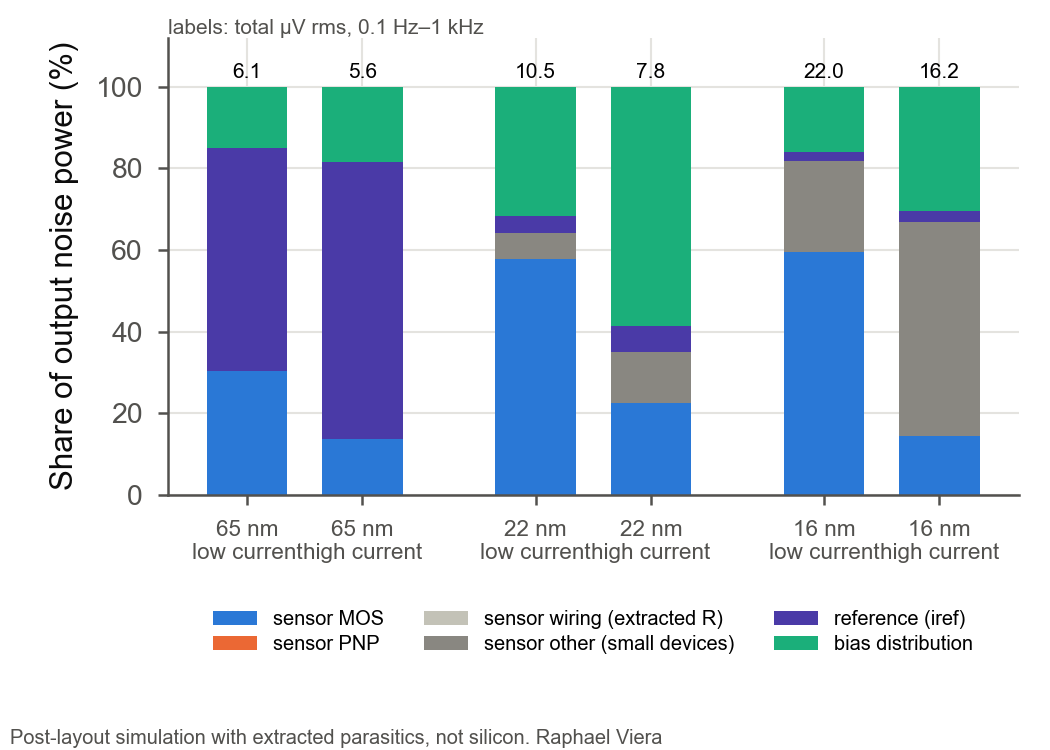
Enable and current-state switching
Monte Carlo (every chip calibrated on its own)
Power
Area by function
Literature comparison
Scroll sideways to inspect every column. The complete source comparison is retained, including calibration, sample counts and measurement basis.
Published designs (silicon) against this work (post-layout simulation, not silicon); values as stated in each primary source, DOI links to the publisher.
| # | Reference | Venue | Year | Process | Type | Area | Power @ supply | Range (C) | Inaccuracy (stat, trim, N) | Resolution | Conv. time | Basis | DOI | Values from |
|---|---|---|---|---|---|---|---|---|---|---|---|---|---|---|
| [1] | M. A. P. Pertijs et al. | JSSC | 2005 | 0.7 um CMOS | Substrate PNP, VBE/dVBE (5:1 bias)†, 2nd-order SC ΔΣ; full sensor | 4.5 mm^2 (chip)† | 75 uA, 2.5-5.5 V† | -55 to 125 | ±0.1 (3σ, 1-pt trim at 30 C†, N=24†) | 0.01 C rms at 10 conv/s† | 10 conv/s† | Meas., 24† | 10.1109/JSSC.2005.858476 | abstract + ISSCC'05 digest full text† |
| [2] | K. Souri et al. | JSSC | 2013 | 0.16 um CMOS | PNP, VBE/dVBE, zoom ADC (5b SAR + 10b ΔΣ); decimation off-chip | 0.08 mm^2 | 3.4 uA @1.5-2 V (excl. off-chip digital) | -55 to 125 | ±0.15 (3σ, batch cal + RT voltage cal + PTAT trim, N=18); ±0.25 (lot 2, N=18 ceramic + 22 plastic); ±0.6 batch cal only | 20 mK rms (5 mK in 100 ms) | 5.3 ms | Meas., 18+18+22 | 10.1109/JSSC.2012.2214831 | full text |
| [3] | A. Heidary et al. | ISSCC | 2014 | 0.7 um CMOS‡ | BJT (substrate PNP‡), CT duty-cycle-modulated output | die 1.7 x 1.3 mm‡ | 200 uW (60 uA @3.3 V)‡ | -45 to 130 | spread < ±0.15 (3σ, single RT trim, N n/s) | 3 mK | 2.2 ms | Meas. | 10.1109/ISSCC.2014.6757410 | abstract + TIE'17 full text‡ |
| [4] | B. Yousefzadeh et al. | JSSC | 2017 | 0.16 um CMOS | Substrate PNP, zoom ADC; digital off-chip | 0.16 mm^2 (core) | 4.6 uA @1.8 V nom. (1.5-2 V) | -55 to 125 | ±0.06 (3σ, batch cal + RT PTAT trim, N=20); ±0.1 (3σ, common params + 1-pt, N=80 / 3 batches) | 15 mK rms | 5 ms | Meas., 20 / 80 | 10.1109/JSSC.2016.2638464 | full text (accepted manuscript) |
| [5] | B. Yousefzadeh and K. A. A. Makinwa | JSSC | 2020 | 0.16 um CMOS | PNP, low-leakage SC ADC + on-chip heater | 0.15 mm^2 (incl. 0.017 mm^2 heater; TDC 0.05 mm^2) | 5.41 uA @1.8 V (9.75 uW) | -40 to 180 | ±0.25 (3σ, heater-assisted 2-pt voltage cal, N=24); ±0.2 (3σ, 1-pt temperature trim) | 23 mK rms | 20 ms | Meas., 24 | 10.1109/JSSC.2019.2953834 | full text |
| [6] | Z. Tang et al. | JSSC | 2023 | 0.18 um CMOS | PNP, capacitively biased, SC ΔΣ with inverter-based integrators; sinc2 off-chip | 0.25 mm^2 | 810 nW @0.95 V (RT) | -55 to 125 | ±0.15 (3σ, 1-pt PTAT trim, N=20); ±0.45 batch cal only | 1.8 mK rms | 128 ms | Meas., 20 | 10.1109/JSSC.2023.3308554 | full text |
| [7] | N. G. Toth and K. A. A. Makinwa | JSSC | 2024 | 0.18 um CMOS | NPN, beta-compensated current-mode front end, CT ΔΣ | 0.07 mm^2 | 2.5 uA @1.4 V (1.4-2.2 V) | -55 to 125 | ±0.1 (3σ, RT trim + resistor-ratio cal, N=40 on 20 dies)§; ±0.2 RT trim only; ±0.25 voltage cal | 1.2 mK rms | 38.4 ms | Meas., 40 | 10.1109/JSSC.2024.3440071 | full text |
| [8] | N. G. Toth et al. | JSSC | 2025 | 0.18 um CMOS | PNP, resistor V-to-I front end, CT ΔΣ | 0.12 mm^2 (per sensor) | 9.5 uA @1.7 V (1.7-2.2 V) | -55 to 125 | ±0.1 (3σ, RT trim + resistor-ratio cal, N=40 on 20 dies)§; ±0.17 RT trim only, or voltage cal | 1.1 mK rms | 40 ms | Meas., 40 | 10.1109/JSSC.2024.3402131 | full text |
| [9] | N. G. Toth and K. A. A. Makinwa | ISSCC | 2025 | n/s | NPN, charge-balancing CT ΔΣ | 0.05 mm^2 | -70 to 125 | 0.1 (3σ, trim n/s, N n/s) | Meas. | 10.1109/ISSCC49661.2025.10904777 | abstract only | |||
| [10] | F. Sebastiano et al. | JSSC | 2010 | 65 nm CMOS | Vertical NPN (deep n-well collector), SC ΔΣ; decimation off-chip | 0.1 mm^2 (active) | 8.3 uA @1.2 V (title: 10 uW) | -70 to 125 | ±0.2 (3σ, 1-pt trim at 30 C, N=16); ±0.5 (3σ, batch cal, N=12) | 0.03 C (quantization-limited) | 2.2 Sa/s | Meas., 12 / 16 | 10.1109/JSSC.2010.2076610 | full text (author draft)* |
| [11] | J. S. Shor and K. Luria | JSSC | 2013 | 32 nm and 22 nm CMOS | BJT; BJT voltage and reference each converted to frequency, ratio taken digitally | 0.02 mm^2 (32 nm) / 0.006 mm^2 (22 nm), incl. all digital | 3.8 mW / 1.4 mW @1.4 V (unregulated) | ±0.2 C rms (as written) | 2-20 kS/s | Meas. | 10.1109/JSSC.2013.2280039 | abstract only | ||
| [12] | T. Oshita et al. | JSSC | 2015 | 14 nm tri-gate (FinFET) CMOS | BJT, compact processor hot-spot sensor | 0.0087 mm^2 | 1.1 mW | 0.5 C | > 50 kS/s | Meas. | 10.1109/JSSC.2015.2396522 | abstract only | ||
| [13] | M. Eberlein and I. Yahav | VLSI | 2016 | 28 nm CMOS | Parasitic NPN, current mode, 8 b | 0.0038 mm^2 | 16 uA @1.8 V | -20 to 130 | 1.8 (3σ, no calibration); ~±0.8 (1-pt soft trim) | Meas. | 10.1109/VLSIC.2016.7573532 | abstract only | ||
| [14] | Y.-C. Hsu et al. | ISSCC | 2017 | n/s* | Dynamic-distributing-bias sensor (device n/s in abstract) | 0.00946 mm^2 | 18.75 uW | 0.87 (3σ, untrimmed; title); relative 1.64 % (abstract)* | Meas. | 10.1109/ISSCC.2017.7870281 | abstract only | |||
| [15] | D. S. Lin and H. P. Hong | A-SSCC | 2017 | 10 nm FinFET | BJT, charge pump for 0.5 V operation, SC-integrator V-to-f | 0.01 mm^2 | 125 uW @0.5 V | ±2.8 (3σ spread at 85 C only; trim n/s) | ±0.173 C rms (as written) | Meas. | 10.1109/ASSCC.2017.8240211 | abstract only | ||
| [16] | C.-Y. Lu et al. | ISSCC | 2018 | 22 nm FinFET | Hybrid parasitic PNP + subthreshold NMOS, current mode, 8 b; single-element remote PNP (0.00021 mm^2) + one wire to the main sensor | 0.0043 mm^2 (system) | 50 uA @1 V | ±1.07 (±3σ, 1-pt voltage-based soft trim) | Meas. | 10.1109/ISSCC.2018.8310312 | abstract only | |||
| [17] | Z. Tang et al. | TCAS-II | 2019 | 55 nm CMOS | Substrate BJT, current mode, dynamic beta compensation | 0.0146 mm^2 | 37 uW | -40 to 125 | ±1.7 (3σ, untrimmed) | 12-15 bit (adjustable) | 4.1-32.8 ms | Meas. | 10.1109/TCSII.2019.2921889 | abstract only |
| [18] | M. Eberlein and H. Pretl | ESSCIRC | 2019 | 16 nm FinFET | Bulk diodes, NOT BJT*; charge-pump biased; capacitive SAR charge balancing | 2500 um^2 (active) | 230 pJ/conversion (power n/s); down to 0.85 V | consumer range (no numbers) | +1.5/-2.0 (min/max, no calibration) | 12.8 us | Meas. | 10.1109/ESSCIRC.2019.8902928 | abstract only | |
| [19] | Z. Tang et al. | JSSC | 2025 | 22 nm bulk CMOS | Parasitic PNP, capacitively biased via regulated charge pumps, charge-balancing ΔΣ; sinc2 off-chip | 0.01 mm^2 (core) | 2.9 uW @0.8 V (RT)* | -40 to 125 | ±0.4 (3σ, 1-pt offset trim, N=23); ±1.25 untrimmed | 4.7 mK rms (88 mK) | 6.4 ms (0.82 ms) | Meas., 23 | 10.1109/JSSC.2024.3523482 | full text |
| [20] | Y. Li et al. | JSSC | 2025 | 4 nm FinFET | Parasitic PNP + subthreshold MOS; dual temperature-sensor / sub-1-V BGR | 0.0061 mm^2 (stated as BGR footprint)* | 68.5 uW | n/s in abstract | 0.46 C | 7 us | Meas. | 10.1109/JSSC.2024.3524245 | abstract only | |
| [21] | X. Pu et al. | JSSC | 2015 | 65 nm digital CMOS | Remote BJTs (on PCB or in the SoC) read by an embedded sensor that shares an external reference with the SoC's other data converters; digital beta correction | -40 to 130 | 0.4 (3σ, trim n/s, N=16 with 4 BJTs) | Meas., 16 | 10.1109/JSSC.2015.2434845 | abstract only | ||||
| [22] | O. Bass and J. Shor | TCAS-I | 2020 | 65 nm CMOS | PNP, switched-capacitor bandgap, 1-bit ΔΣ | 0.003 mm^2 | ±1.35 total (±3σ, digital trims, N n/s)* | 65 mK | 4.1 ms | Meas. | 10.1109/TCSI.2020.2987595 | abstract only | ||
| [23] | O. Bass and J. Shor | TCAS-II | 2020 | 65 nm CMOS | PNP, charge balancing; 50 um^2 sensing element | 1450 um^2 | 150 C span | -2/+4 (p-p, 1-pt trim); -2.5/+1.5 (p-p, 2-pt trim) | 0.22 C | 821 us | Meas. | 10.1109/TCSII.2020.2999494 | abstract only | |
| [24] | J.-H. Park et al. | JSSC | 2022 | 0.11 um CMOS | BJT core + relaxation-oscillator T-to-f converter (CTAT/PTAT ratio) | 0.025 mm^2 (active) | 3.1 uW | -40 to 140 | ±1 (3σ, "with the digital trimming", N=18)* | Meas., 18 | 10.1109/JSSC.2022.3182708 | abstract only | ||
| [25] | J. Yang et al. | TCAS-II | 2025 | 0.18 um CMOS | BJT, VBE2/VBE1 digitized directly by a 12-bit SAR ADC (no amplifier) | 0.02 mm^2 | 30 uA @1.8 V (RT) | -40 to 120 | ±0.6 (3σ, trim n/s, N n/s) | 16 us | Meas. | 10.1109/TCSII.2025.3564315 | abstract only | |
| this work | This work | post-layout | 2026 | 65 nm CMOS | Vertical PNP, switched-current 1 : 8 ΔVBE front end; readout by the chip's shared monitor / ADC (not included) | 0.001125 mm^2 (front end) | 22.6 uW @1.2 V (front end incl. its 10-uA bias) | 0 to 85 (spec); -40 to 125 | ±0.08 (3σ, 2-pt cal. per chip, MC N=200); ±0.68 (3σ, 1-pt trim); −40..125: ±0.29 (2-pt) | front-end noise 45 mK rms (0.1 Hz-1 kHz) | settles in 1.00 us | post-layout simulation, MC 200 | - | this work |
| this work | This work | post-layout | 2026 | 22 nm FD-SOI | Vertical PNP, switched-current 1 : 8 ΔVBE front end; readout by the chip's shared monitor / ADC (not included); 1.8-V devices + follower | 0.000977 mm^2 (front end) | 50.6 uW @1.8 V (+0.8-V logic) (front end incl. its 10-uA bias and follower) | 0 to 85 (spec); -40 to 125 | ±0.44 (3σ, 2-pt cal. per chip, MC N=200); ±1.83 (3σ, 1-pt trim); −40..125: ±1.60 (2-pt) | front-end noise 72 mK rms (0.1 Hz-1 kHz) | settles in 0.08 us | post-layout simulation, MC 200 | - | this work |
| this work | This work | post-layout | 2026 | 16 nm FinFET | Vertical PNP, switched-current 1 : 8 ΔVBE front end; readout by the chip's shared monitor / ADC (not included); 1.8-V devices + follower | 0.000407 mm^2 (front end) | 50.3 uW @1.8 V (+0.8-V logic) (front end incl. its 10-uA bias and follower) | 0 to 85 (spec); -40 to 125 | ±0.15 (3σ, 2-pt cal. per chip, MC N=200); ±5.98 (3σ, 1-pt trim); −40..125: ±0.86 (2-pt) | front-end noise 153 mK rms (0.1 Hz-1 kHz) | settles in 0.12 us | post-layout simulation, MC 200 | - | this work |